Data Analysis: Maps are Superior to Spreadsheets
WebGIS Stands Out Against Common Analysis Tools
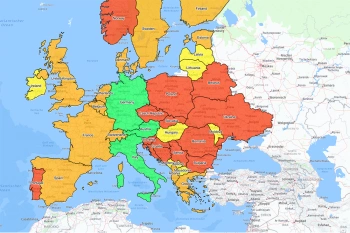
WebGIS users know that they can display data on maps much faster and better than in spreadsheets. One study wanted to empirically prove the effect and found that compared to spreadsheets, maps bring 59% time savings and 40% fewer errors in decision making. You too can take advantage of this simple fact!
Study Shows What Users Have Known for a Long Time
Smelcer and Carmel* compared the use of maps and spreadsheets with business problem solving shortly before the turn of the millennium. Because the development of GIS systems opened up new possibilities for the visualization of data, they wanted to prove and quantify the practical experience that shows it is much easier and quicker to capture relationships on maps than in spreadsheets.
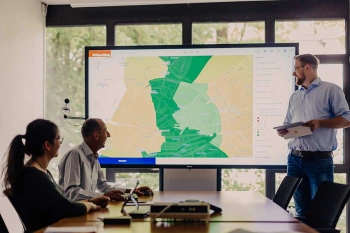
“‘Now I understand!’ Even 20 years later, we often hear the awe of our customers when they see their company data displayed clearly on a map for the first time,” says Wolf Graf, Managing Director of WIGeoGIS.
The results of the study were nevertheless surprising in magnitude and clarity: When solving problems with spatial reference**, the subjects using maps
- made decisions 59% faster
- and made 40% fewer mistakes
than when using spreadsheets.
This is all the more remarkable when you realize that almost 80% of all company data contains spatial references (addresses, sales regions, tours, etc.). With WebGIS, the software for the spatial visualization of data, you can thus perform numerous, analyses for a wide variety of topics such as location planning, sales, target group und marketing, market penetration, potential exploitation, performance and much more.
The explanation of why we can read maps so much better than spreadsheets is quite simple, and, although sufficiently researched, requires little scientific proof: The eye is the most important sensory organ and we take in over 80% of all information via our sense of sight. And although we also take in writing with our eyes, the brain processes images 60,000 times faster than texts. Writing must first be decoded and this not only takes time, it is also exhausting.
*John B. Smelcer, Erran Carmel: The Effectiveness of Different Representations for Managerial Problem Solving: Comparing Tables and Maps, American University Washington DC, 1997 Read the study here
**The tasks were: combine regions into a sales area, select a branch location, optimize a route.
59% quicker decisions, 40% fewer errors! You too can enjoy the advantages of presenting your data on interactive maps!
Map or Spreadsheet? – Map, Please!
In case of doubt, almost always the map. Because nearly 80% of all company data has a spatial reference. WebGIS makes it possible. See for yourself!
WIGeoWeb: Fill out the form, test it free of charge & without obligation!
- Non-binding, free test for 30 days
- Test ends automatically without cancellation
- An employee will explain the tool in a short webinar*
* Information about the free test access: Standard regions with selected data in Germany or Austria will be made available. In Germany, these regions are districts in Munich and environs, and districts of Vienna and environs in Austria. The products of WIGeoGIS are intended for companies and are not suitable for private use. If you need a one-time market analysis, we will gladly make you a service offer.

WIGeoWeb: WebGIS for Geomarketing
WIGeoWeb is your online GIS for business analysis. Interactive maps. Visualize data. Simple. Intuitive. The WebGIS for your company.

Make an Interactive Map
With WIGeoWeb, you can display your company on the map. Interactive and worldwide. Customers, sales areas, sales - everything at a glance.

Analyze Data with WIGeoWeb
With WebGIS, you can analyze data intuitively and get understandable results. The georeference reveals information that traditional tools can not show you.

WIGeoWeb in Real Estate Appraisal
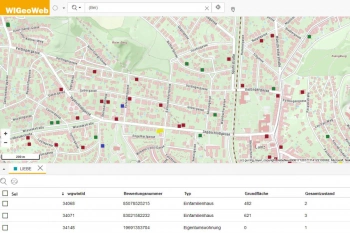
For example, Real(e)value enhances its proven, high-performance real estate appraisal tool by spatially representing the data using WebGIS.

