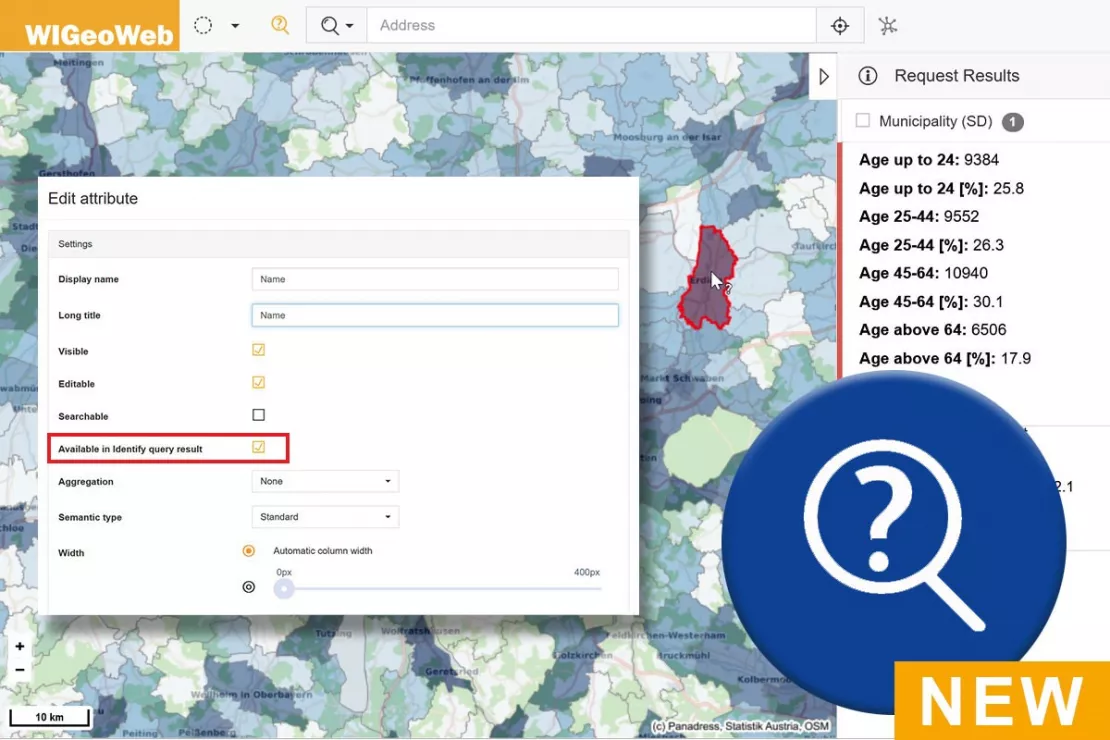
WIGeoWeb 5.1. – Practical Functions Allow You to Work Even Faster with WebGIS
With the new release, you can work even more efficiently and quickly. The highlights at a glance.
Achieve your goal even faster – That is the motto for WIGeoWeb Release 5.1. We have made our WebGIS software even easier and more practical for your everyday analyses. So that you can get results and achieve your goals faster.
WIGeoWeb is the geomarketing WebGIS that allows you to analyze and easily understand data by visualizing it on an interactive map. Market reports can then be created with the push of a button.
WIGeoWeb Highlights in Use
This video will show you how to use the new features of WIGeoWeb 5.1.
Test the new WIGeoWeb for 30 days, free with no obligation. The trial period ends automatically.
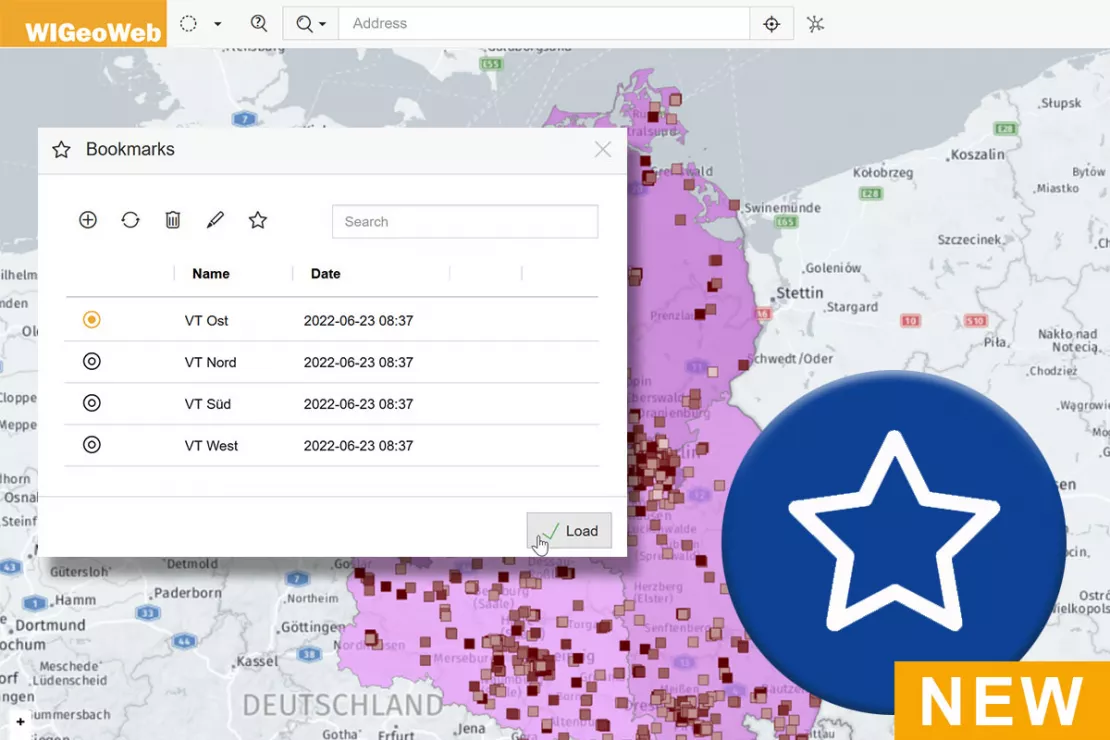
Bookmark Function – Save Your Favorite Analyses
With the new bookmark function, you can save analyses and map views that you need and use frequently. You can open the saved maps by clicking on the star. This feature is also useful if you frequently do analyses in a specific region.
EXAMPLE: You would like to keep an eye on important locations or areas over time and present the development in a review discussion.
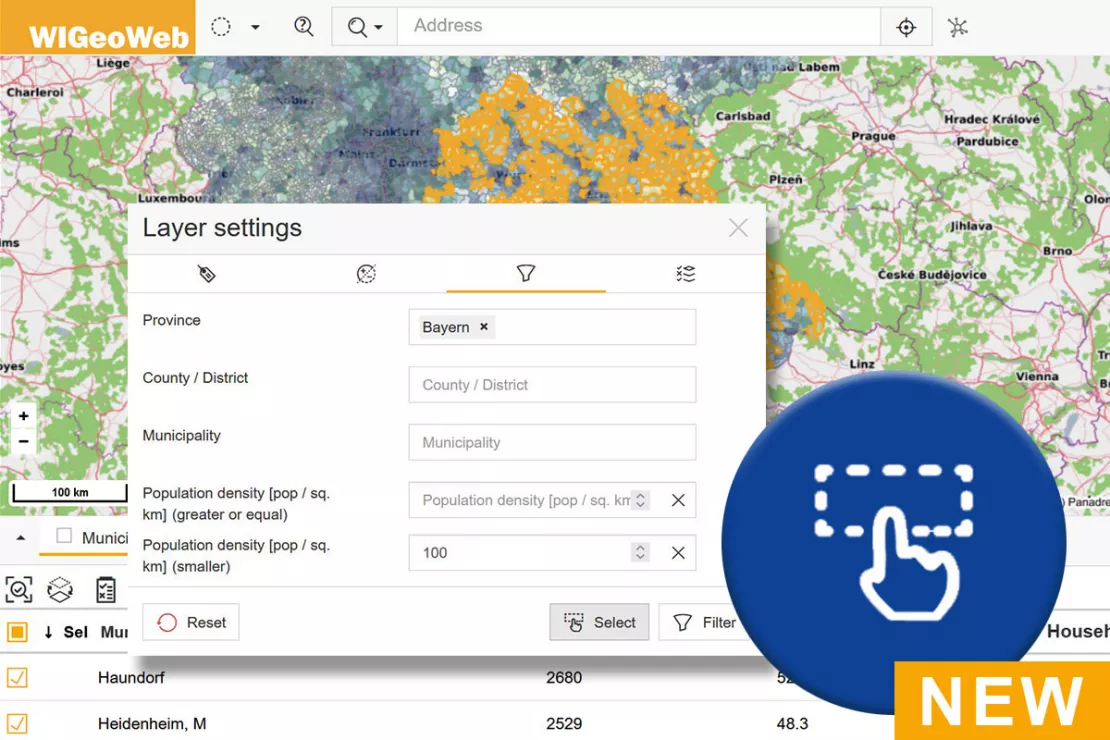
Attribute Selection
WIGeoWeb now also offers new attribute selection methods. This function allows you to select all the data records that match your query based on the available attributes. You can then start further analysis steps with the selected objects.
EXAMPLE: You would like to see the purchasing power data in all the ZIP Code areas in Bavaria with a large number of inhabitants. Simply select the areas with high population numbers in WIGeoWeb and create a report for these areas.
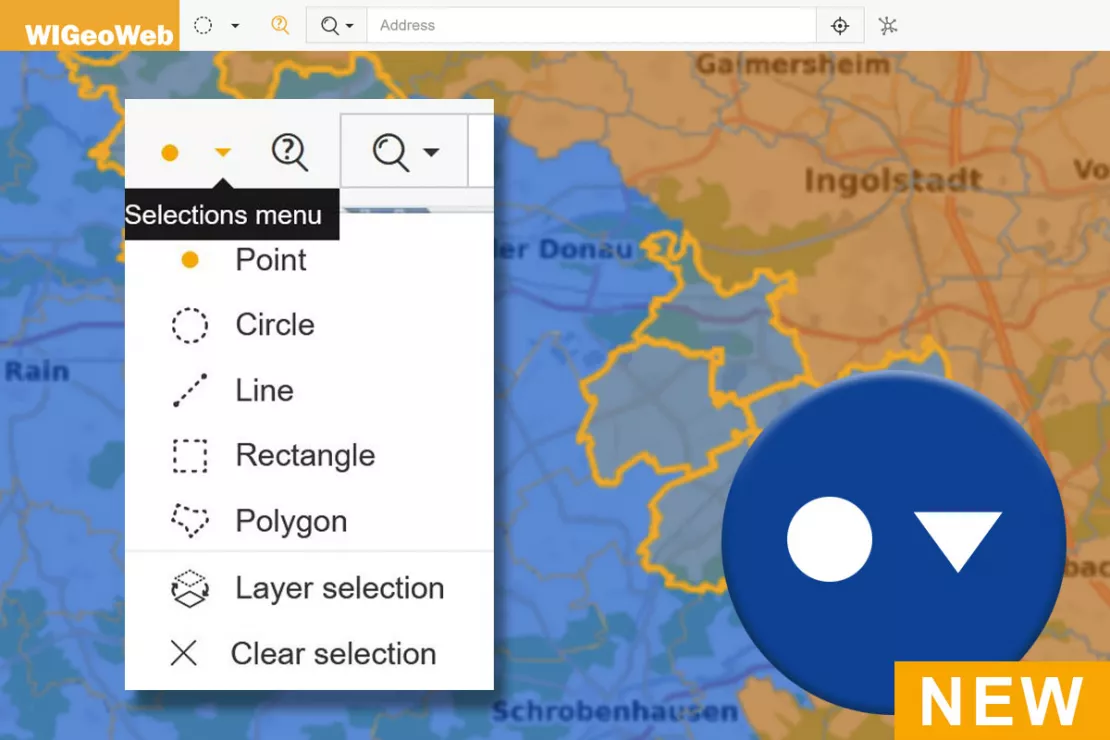
Multiselect Function
The selection tools have been optimized: If you have already selected objects in the map, it is now even easier to add further objects to this selection or remove them from the selection using the map. The selected objects are highlighted on the map and in the data table and you can use them as a starting point for various analyses, for example download, reports or editing.
EXAMPLE: You looked at the organic purchasing power in Freiburg. Now you would like to know about the organic purchasing power in Villingen-Schwennigen, Mulhouse and Basel and compare them. Simply click on the areas and add them to your analysis.
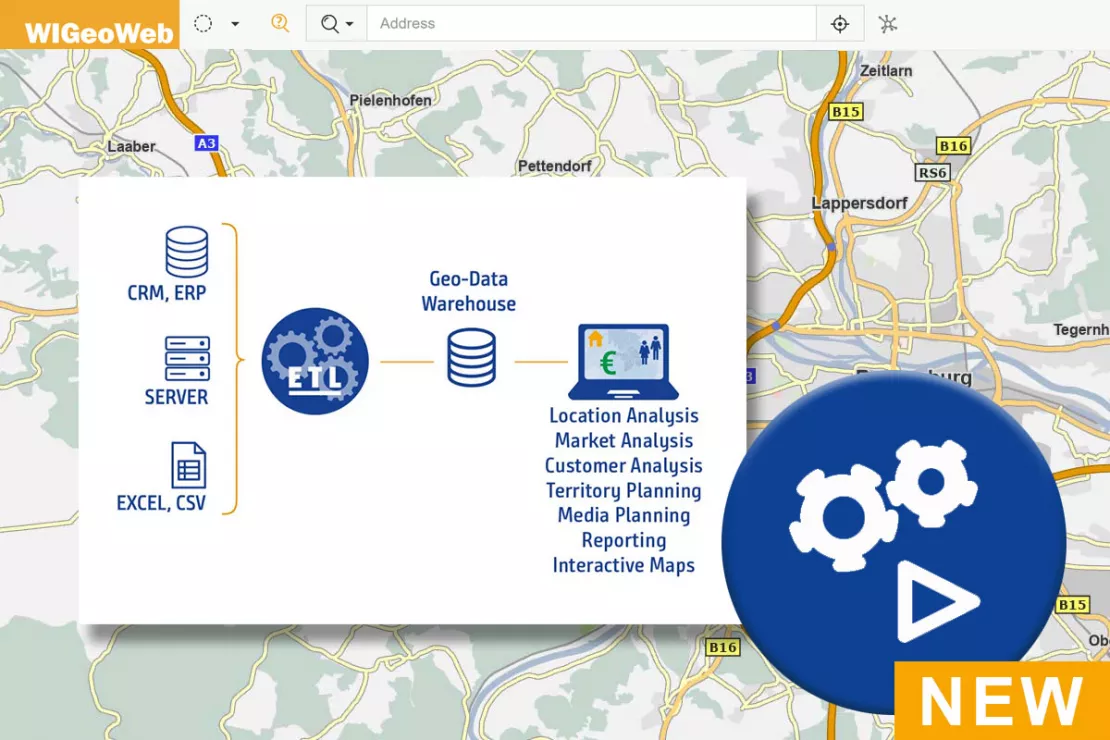
Automated Data Processing
Click on the gear icon to start data processing tasks. All processing is done via the Python-based standard interface WIGeoETL and can be flexibly adapted to your specific needs.
EXAMPLE: Different data about your locations is regularly expanded, e.g. sales figures, customer surveys, bestsellers. Thanks to the automated data processing, this data always arrives correctly (no transmission errors) and promptly in the WebGIS and is available for analysis.
Test all the WIGeoWeb functions for free with no obligation. The trial period ends automatically.
WIGeoWeb Not Only Makes Your Business Better, but Also Faster
With the WebGIS WIGeoWeb, you can analyze your markets and visualize your data on an interactive map clearly, intuitively and easily. You understand your business better and can act faster. The new functions give your analyses additional momentum.
WIGeoWeb: Fill out the form, test it free of charge & without obligation!
- Non-binding, free test for 30 days
- Test ends automatically without cancellation
- An employee will explain the tool in a short webinar*
* Information about the free test access: Standard regions with selected data in Germany or Austria will be made available. In Germany, these regions are districts in Munich and environs, and districts of Vienna and environs in Austria. The products of WIGeoGIS are intended for companies and are not suitable for private use. If you need a one-time market analysis, we will gladly make you a service offer.

