Reporting Tool with Spatial Reference
Manage KPIs, measure success, support operational action with WIGeoWeb
- Reporting software that is simple and intuitive to use
- Standardized and automated reports
- Adapted to the needs of your company
- Reporting meets location intelligence!
The intuitive reporting tool that focuses on the WHERE: WIGeoWeb
An effective and easy-to-use reporting software is essential so that companies can manage today's flood of data.
The goal of a report is to provide meaningful, condensed and helpful information. Managers use this condensed knowledge as a basis for strategic decisions and operational management.
Many reporting tools neglect a crucial component in analysis and visualization, namely the component of “space”, i.e. WHERE the business takes place, where it is good and where it is unsatisfactory. The WIGeoWeb software includes the spatial component and shows you the WHERE:
- Where are my customers?
- Where do I reach my sales targets?
- Where am I lagging behind in market coverage?
- Where is the competition stronger than me?
With WIGeoWeb, you share knowledge about performance in an understandable way, in real time, across departments and countries.
WIGeoWeb is a WebGIS software for geomarketing that allows companies to analyze and visualize data. Sales, revenue, customer and market data can be optimally combined with one another. This makes WIGeoWeb a tool that companies can use to ideally manage business strategies, sales and marketing activities. WIGeoWeb includes the reporting tool that generates KPI reports based on spatial analysis at the push of a button.
Advantages
- Simple and intuitive operation
- Self-service 24/7: independence from other departments since KPIs, data and reports are available anytime and anywhere
- Access to all the necessary data: all the necessary data is available in the system or quickly available via Excel upload
- Time saving
- One click for a comprehensive and complete report

From planning to report on all hierarchies with WIGeoWeb: Company goals are broken down and operationalized down to the individual employee. Each individual should implement the goals in their daily work. The reports from WIGeoWeb make Key Performance Indicators (KPIs) spatially visible and management easier.
Try It Yourself to See How Well Reporting with Spatial Reference Really Works!
Features
- Standardized report for ideal comparability and objectifiability of the data
- Report according to geographic objects and with spatial reference
- Product report - sales and turnover figures
- Rights-role management: Allocation of reports to certain user groups
- Simulations, forecasts, what-if scenarios: changes to current sales areas, output of the associated report
- Data visualization on maps, in graph tables
- Insert individual text blocks in reporting
- Different output formats: PowerPoint, Word, PDF, Excel
Reporting with Spatial Reference: Set Goals, Measure Goals, Take Action
The idea for using WebGIS software as a reporting tool is to be able to realistically check the definition of goals using spatial data. That is why geospatial data must be integrated into the standard reporting and included in the process.
WIGeoWeb is a professional reporting tool based on WebGIS technology, making spatial data the basis for all analyses. The software enables you to create interactive data visualizations and delivers standardized reports in just a few minutes. The reports contain all the relevant key figures. This means that data is transformed into visualized information such as target-actual comparisons and deltas for planning. You can monitor all the important business processes at any time. Based on this information you can make faster, better and data-driven decisions.
You benefit from WIGeoWeb because you see your reporting from a spatial point of view, which results in a transparent and complete picture of your market activities.
Geographic information systems (GIS software) can be used very well in practically every level of the management process. By clearly visualizing key figures, such systems provide significant help with the management and implementation of strategies, for example:
- the spatial planning of the strategy
- the operationalization of goals for individual teams, employees and regions
- the reporting and delta analysis from a single region to the overall picture for the company
- management measures, so that geographically differentiated actions can be taken quickly
Simple Practical Example for WebGIS as a Reporting Tool
- Set target with spatial reference: 3% increase in the sales of premium lawnmowers in a region based on potential (i.e. number of one and two family houses with a garden). The realistic goal is calculated based on the number of customers in this region.
- Measure if the target has been achieved: Generate the standard report on sales quantities per region at the push of a button.
- Take measures: perform further analyses, also including spatial data, to find and implement appropriate measures.
How Spatial References are Displayed in Reports
With a reporting tool with spatial reference, you can generate KPI reports and reports based on:
- Addresses: any address worldwide
- Locations: own branch locations, potential locations, competitor locations
- Areas (e.g. assigned to employees): postcodes, municipalities, districts, federal states, sales areas, sales representative areas etc.
- Products: KPIs such as sales, revenue, complaints etc.
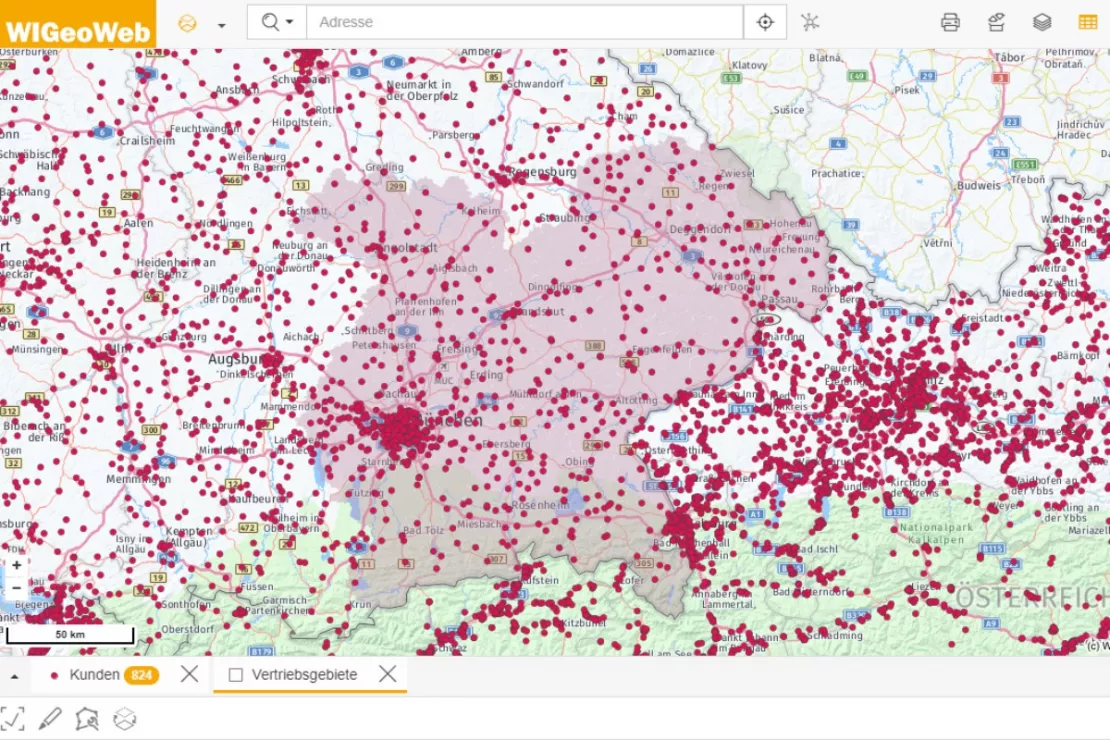
Sales Area Reporting
- Use the sales areas layer to select reporting for one or more of your sales areas.
- The tool generates a standardized report in the format of your choice, for example PowerPoint.
- You can download the report or email it to any recipient directly from WIGeoWeb.
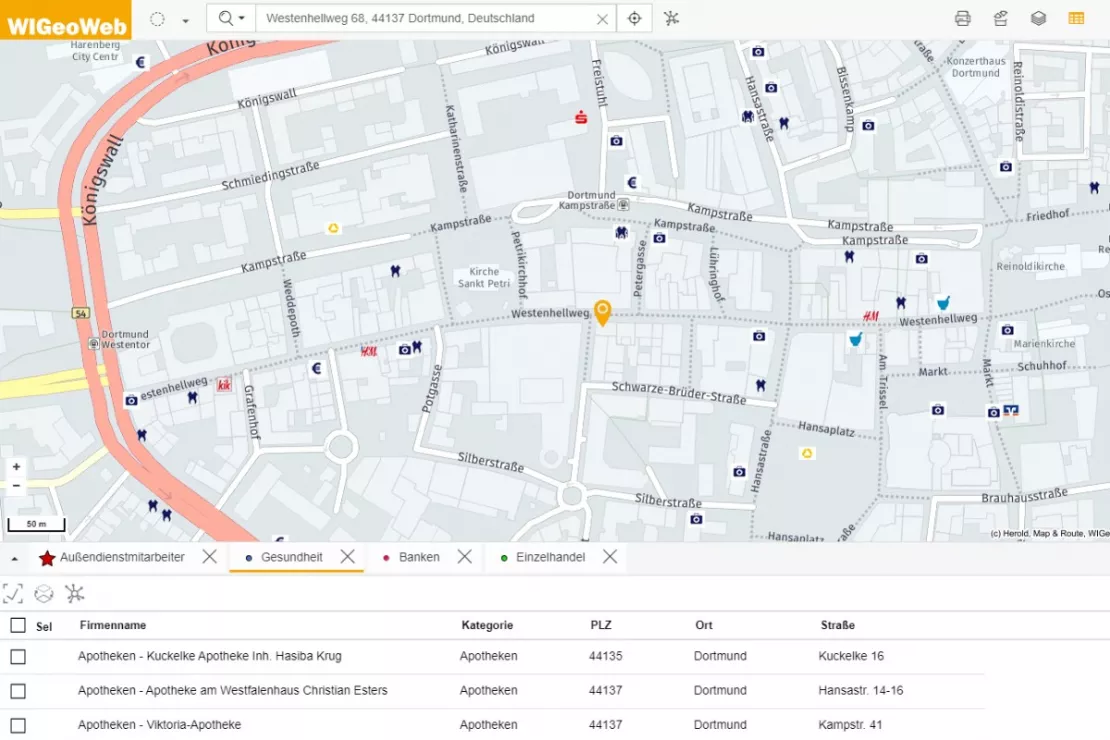
Reporting for a Specific Address
- Enter any address. It can be the address of a branch location, sales partner or competitor.
- Select the relevant market data for the address you are looking for (retail data in this example).
- If necessary, adjust the preset catchment areas.
- The report is generated automatically and made available via download or e-mail.
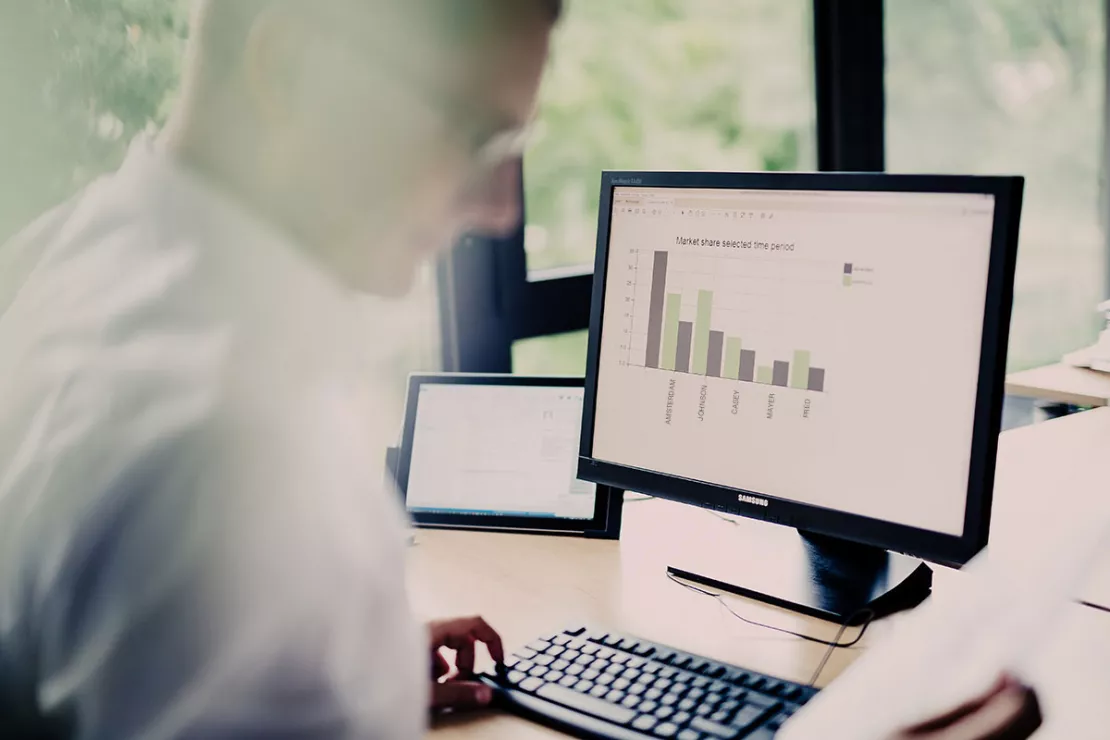
Product Reporting
Would you like to know the market situation for a specific product? The reporting software can do this as well as show you at a glance where you are selling a product particularly well or lagging behind the potential, where there are particularly many complaints, returns, service requests or repeat purchases etc.
Prepared for the Boss
With WIGeoWeb as a reporting tool, you are well prepared for every detailed question your boss might ask in a business review. All the facts and figures are current and available in WebGIS. The tool filters and analyzes in real time. So you can really give a clear answer to any question your boss might have regarding sales, market penetration, customers, products, etc.
Interactive Reporting in Real Time
WIGeoWeb is perfect for your everyday business. The tool not only works on PC, but also on your tablet, so you always have your data and reports at hand in any situation.
Classic Formats (PowerPoint, Word, PDF, Excel) in Your Corporate Design
The software allows you to generate standardized reports in classic and widespread formats such as Power Point, Word, PDF and Excel at the push of a button. The reports can use the corporate design of your company.

WIGeoWeb can do interactive and digital reporting as well as traditional reporting on paper. You decide when to use which option.
Customer Opinions
“With the help of spatial reporting, we are able to assess the potentials and weaknesses of markets, stores and locations. This helps to weigh the opportunities and risks and make the right decision.”
Jens-Eric Bahr, HypoVereinsbank
“With WIGeoWeb as a reporting tool, corporate strategies and goals can be broken down clearly for the individual employee. In addition, it is possible to make an ideal comparison of the overall goals (top down) with the actual potential in the market (bottom up). In our day-to-day life as a management consultant, we often see that this is exactly where companies have problems due to breakdowns in the process. With WIGeoWeb we regularly solve these problems for our customers.”
Andreas Ortner, Bezan & Ortner Management Consulting GmbH
Test the Reporting Tool for Free!
Want to Know More About WIGeoWeb as a Reporting Tool? Practical examples and further information:

Transparent market reporting for banks with geomarketing
The Unicredit HypoVereinsbank (HVB) uses geomarketing to measure the success and potentials of its branches in Germany.
WIGeoWeb: WebGIS for Geomarketing
WIGeoWeb is your online GIS for business analysis. Interactive maps. Visualize data. Simple. Intuitive. The WebGIS for your company.
Why Geomarketing?
Geomarketing allows you to identify your market potential and plan your expansion, sales and marketing activities. WIGeoGIS provides comprehensive support.
Sales Territory Planning
You want to plan, evaluate and divide sales territories for your sales representatives? Here are the key reasons why geomarketing software makes sales and territory planning more efficient.
WIGeoWeb: Fill out the form, test it free of charge & without obligation!
- Non-binding, free test for 30 days
- Test ends automatically without cancellation
- An employee will explain the tool in a short webinar*
* Information about the free test access: Standard regions with selected data in Germany or Austria will be made available. In Germany, these regions are districts in Munich and environs, and districts of Vienna and environs in Austria. The products of WIGeoGIS are intended for companies and are not suitable for private use. If you need a one-time market analysis, we will gladly make you a service offer.
FAQ
-
Is WIGeoWeb a BI reporting tool or a Business Intelligence reporting software?
WIGeoWeb is a WebGIS software It runs in your browser. It can be used as a software as a service (hosting) or as a server installation in your company. This product group is also referred to as Spatial Business Intelligence Reporting Software. In contrast to conventional BI reporting software, a spatial business intelligence tool uses the spatial and geographical location as the basis for analyses and evaluations.
-
Is WIGeoWeb a GIS reporting tool?
Yes, WIGeoWeb is a GIS reporting tool, or more precisely a WebGIS reporting tool, because it runs online.
-
What makes WIGeoWeb stand out when compared directly with other reporting tools?
The biggest difference is that WIGeoWeb uses spatial data, in other words the WHERE, as the basis for all analyses and reports and key figures are visualized on a map. That means, for example, you can see at a glance how and in which areas your key figures (KPIs) are developing.
-
Is the interface for the reporting tool in German?
The interface and reports are available in German and English. You can switch between the two languages whenever you like.

