Top Reporting with WebGIS Software
Create Complex Reports for Any Region in Just 2 Steps With WIGeoWeb
WIGeoWeb is an easy-to-use WebGIS software for geomarketing and comprehensive market analyses. Reporting has been optimized in the current release. Now your analysis report is ready in just 2 steps.
Top Reporting at the Touch of a Button with WebGIS Software
Our goal is to make the spatial analysis of your data easier and easier for you. That is why we are constantly further developing our WebGIS. With the current release of our Geomarketing-Software WIGeoWeb, we have focussed on reporting. This makes data analyses more customized, more complex and at the same time faster and easier to access. At the push of a button, you receive customized reports from current market and company data that provide you with a sound basis for strategic decisions in the company, and that for any area you chose.
The WebGIS software can be used around the clock as software as a service. Or if you prefer, WIGeoWeb can be operated internally in your company.
The New Reporting Works in Just 2 Steps

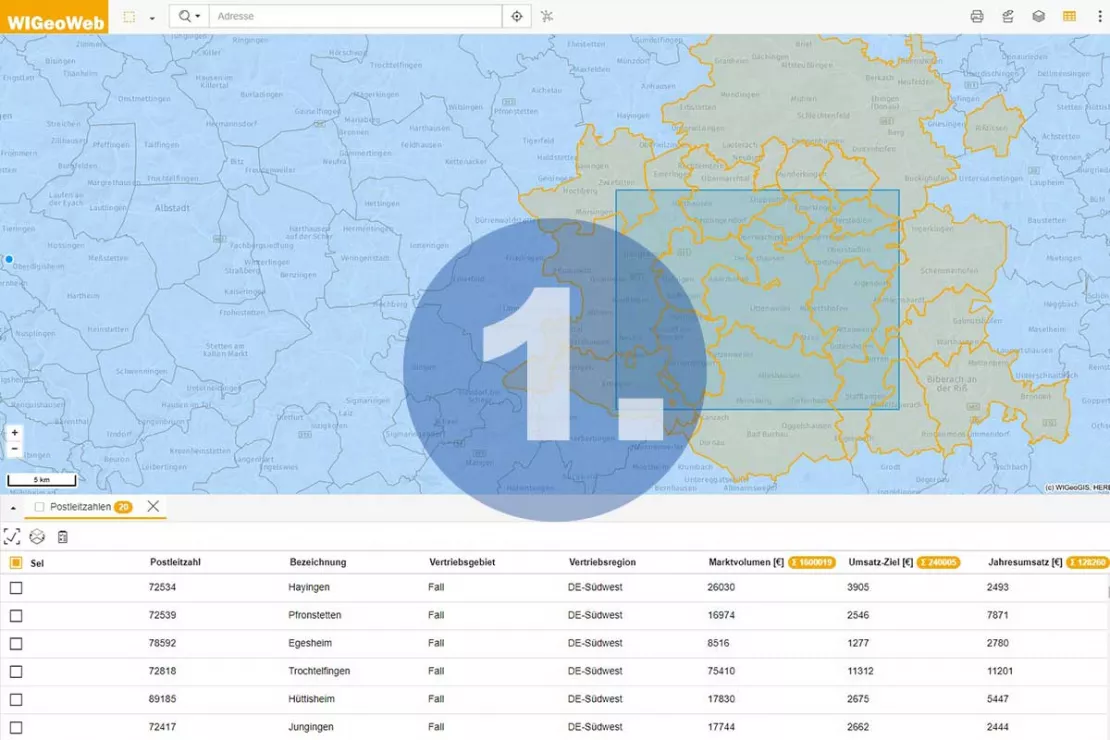
Step 1: Define the Analysis Area
Reports can be created for one as well as for several geo-objects such as:
- Provinces, municipalities, ZIP Codes
- Streets, buildings
- Sales, support, service and retailer areas
- Any areas and regions you select

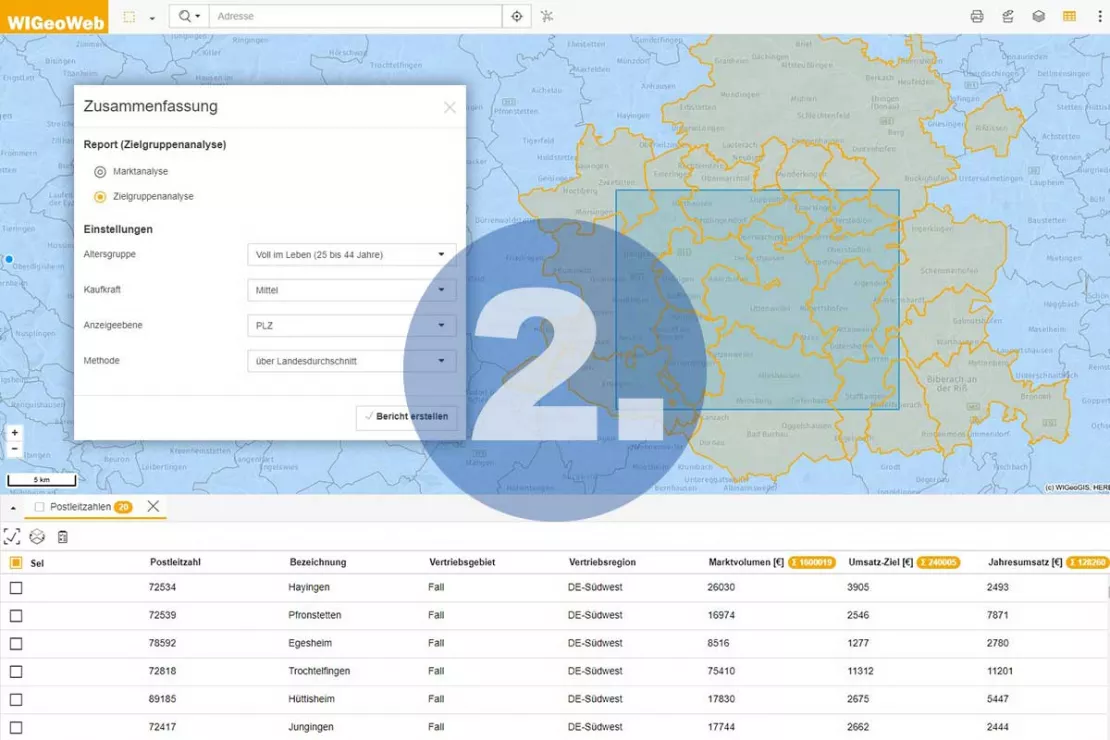
Step 2: Create a Standard Report
- Several standard reports can be set up at the same time within a WIGeoWeb system
- Any combination of input parameters can be defined for each report, for example sales, age and purchasing power of the target group, sales areas, potential customers, etc.
- Every desired type of report is configured at the beginning according to your individual needs, so that in everyday business a mouse click is enough to get to the current report
Test the new WIGeoWeb including reporting for free!
Your Benefits
Reporting is child's play with WIGeoWeb
With our WebGIS software it is now even easier, faster and more customized:
- Analyze sales areas and compare them with one another
- Create market analyses
- Analyze target groups by region
- Find regions with potential
- Plan marketing measures and the distribution of advertising material spatially
- Define risks according to geographical parameters
- Create what-if scenarios for new products or sales areas
- Create in-depth analyses for expansion management
- Evaluate and optimize location networks
- Make reports comparable with each other
- Receive analysis results graphically as maps and diagrams or as tables or texts, without the need to adapt the software
- Reports that used to take several days to create, can be created at the push of a button and in a standardized form, because WIGeoWeb automatically and systematically analyzes the data you have selected, such as region, target group, purchasing power or sales network, and delivers reports ready for presentation as a PDF, Excel or Word file
Showcase Examples for WebGIS Reporting
Market Assessment for Your Products
You are considering expanding your sales area to 30 municipalities in southern Germany and would like to know what the market structure looks like in this region for your product, which is interesting for people with high purchasing power, aged between 45 and 60. You select the necessary key figures such as the area and information about your target group and request your report by clicking on the report icon. After a few seconds you will receive the standardized report with tables, graphics, maps, text and diagrams.
Analysis and Comparison of Your Sales Areas
You would like to know how well your business is doing in downtown Vienna, which is serviced by two of your sales representatives, and how the sales areas of three other colleagues in the outer districts are performing in comparison. Again, you select the desired areas as well as sales and relevant KPIs and within a few seconds you will receive the reports for your request in the formats you want, e.g. as Word or Excel files.
Geographical Planning of Your Advertising Measures
You are planning advertising campaigns aimed at households with at least three residents in Tyrol including East Tyrol and want to know how many and which households belong to your target group. You select the relevant parameters in the dashboard and after a few seconds you will receive a report that you can present directly to the management.
Request a FREE test account for WIGeoWeb!

Extended Data Management in the New Release of WIGeoWeb
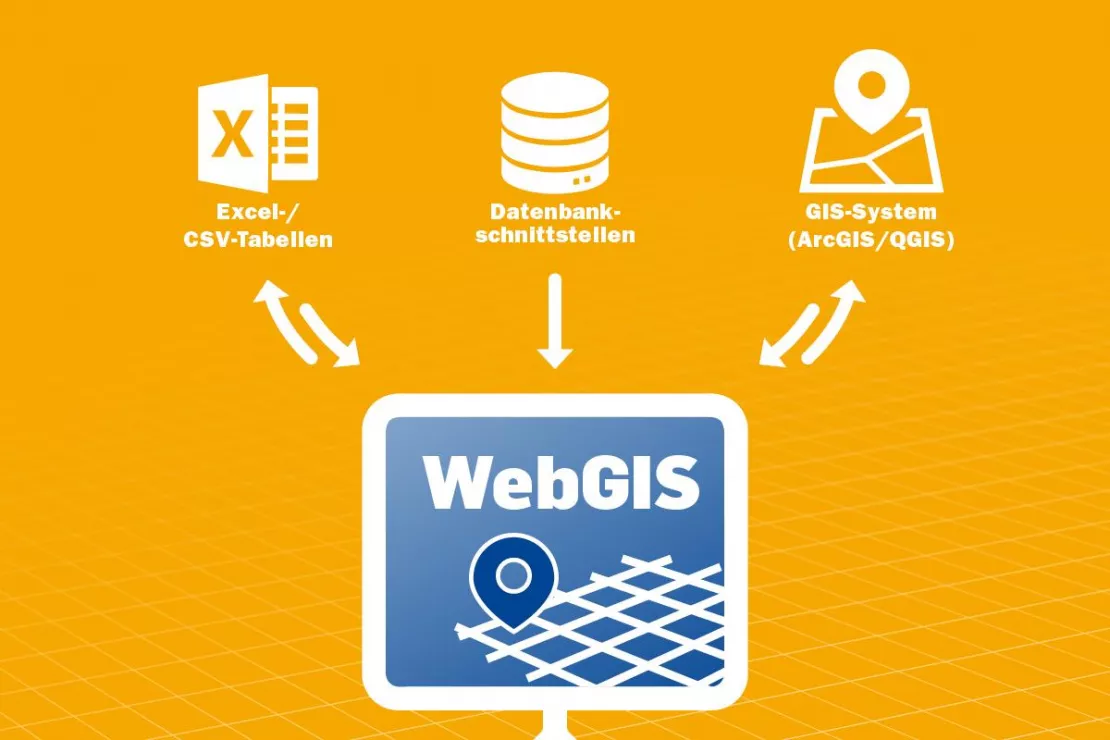
- Now you can integrate Excel tables without IT and GIS knowledge into your WebGIS via the administration modul WIGeoWeb CMS.
- The tables are automatically linked with geodata and displayed as an interactive map.
- Geodata such as digital community or ZIP Code maps, which are already available in the WebGIS system, are used. Of course, it can also be sales or service areas.
This is What Responsible Managers Have to Say About the New Release of WIGeoWeb
“WIGeoWeb is a geographic information tool that is used to display data on a digital map. The new version is significantly more flexible in terms of reporting.”
Thorsten Lange, Senior Consultant WIGeoGIS
“The new release of our WebGIS software makes it possible to set up several reports simultaneously within a WIGeoWeb system.”
Christoph Pichlbauer, Project Manager WIGeoGIS
Here You Will Find Further Information About the WebGIS Software WIGeoWeb

WIGeoWeb: WebGIS for Geomarketing
WIGeoWeb is your online GIS for business analysis. Interactive maps. Visualize data. Simple. Intuitive. The WebGIS for your company.

Reporting Tool and KPI Reports in WebGIS
WIGeoWeb is ideal as a reporting tool that can be viewed interactively on a PC or tablet, or as standard reports via email and print. Manage your KPIs and support operational action.

Cloud GIS - Software as a Service by WIGeoGIS
WebGIS solutions as Software as a Service (SaaS) are convenient, topical and cloud-based. The price to performance ratio is perfect!
WIGeoWeb: Fill out the form, test it free of charge & without obligation!
- Non-binding, free test for 30 days
- Test ends automatically without cancellation
- An employee will explain the tool in a short webinar*
* Information about the free test access: Standard regions with selected data in Germany or Austria will be made available. In Germany, these regions are districts in Munich and environs, and districts of Vienna and environs in Austria. The products of WIGeoGIS are intended for companies and are not suitable for private use. If you need a one-time market analysis, we will gladly make you a service offer.
FAQ
-
Is WIGeoWeb purely a reporting tool?
No, WIGeoWeb is not just a reporting tool, but a map-based software for market analysis and geomarketing. The reports are the result of your market analyses, potential analyses, target group analyses and sales analyses.
-
Does WIGeoWeb run as a reporting tool in the cloud?
The choice is yours. You can use WIGeoWeb as a reporting tool in the cloud and therefore as software as a service, or you can run it on your own company servers.
-
How can I use WIGeoWeb to visualize key figures etc. of my reporting?
WIGeoWeb offers you several options for visualizing your key figures. On the one hand, you can do so directly in the tool while performing your analyses. On the other hand, the data is automatically visualized in the report, prepared in tables and displayed on themed maps. You define the output formats.
-
Can I import Excel data into the WIGeoWeb Reporting Tool?
Yes! You can upload as many Excel files as you like.
-
Can I export figures and reports to Excel from WIGeoWeb?
Yes, that is also possible.
-
Can I use WIGeoWeb as a reporting tool for free?
No, WIGeoWeb is a paid reporting tool. However, you can test it for 30 days free of charge.

