Small-scale Mobility Data
New Data for Your Detailed Planning
How many people commute from A to B on a weekday morning? How many stay near a location during the day? Do more people live or work there? Such questions can be answered on a very small scale with a new data product from WIGeoGIS in cooperation with Statistics Austria.
Mobility Affects Many Industries
As part of the so-called “labor force statistics”, Statistics Austria provides mobility data on the Austrian population. Commuter flows can be evaluated separately for employees and students: Who moves when between home and work or school?
WIGeoGIS prepares this data for spatial analysis and visualization in our new geomarketing data product ArcAustria, which we offer in cooperation with Statistics Austria.
Up until now, high quality commuter data has only been available at the community level. NOW, we can offer this data on a very small-scale in grid cells of 250 x 250 m. This allows you to draw even more conclusions from the data.
5 Questions That You Can Answer With Mobility Data
- When should I keep my restaurant open? Is this mainly a residential area (= the area is empty during the day) or are more people here for work (= office location, nothing is going on in the evening)?
- I am planning a bike or e-scooter rental, a car sharing, an online delivery service. Where do I find my target group?
- How many school buses need to travel between community X and school Y on school days?
- How many bike racks / parking spaces does the train station in Z need?
- I plan locations for retail and know the population. How many people actually stay here during the day? (= residents minus outbound commuters plus inbound commuters)
The examples show the range of industries, as well as public authorities and agencies that can benefit from mobility data. Transport, logistics, gastronomy, retail and public administration are just a few.
Are you interested in mobility data? Try ours for free!
The following application examples were generated with our WebGIS WIGeoWeb. They also show how much easier a digital map can be compared to a classic spreadsheet: The results are clear at a glance.
Example 1: Vienna Wienerberg, Inbound and Outbound Commuters Small-Scale
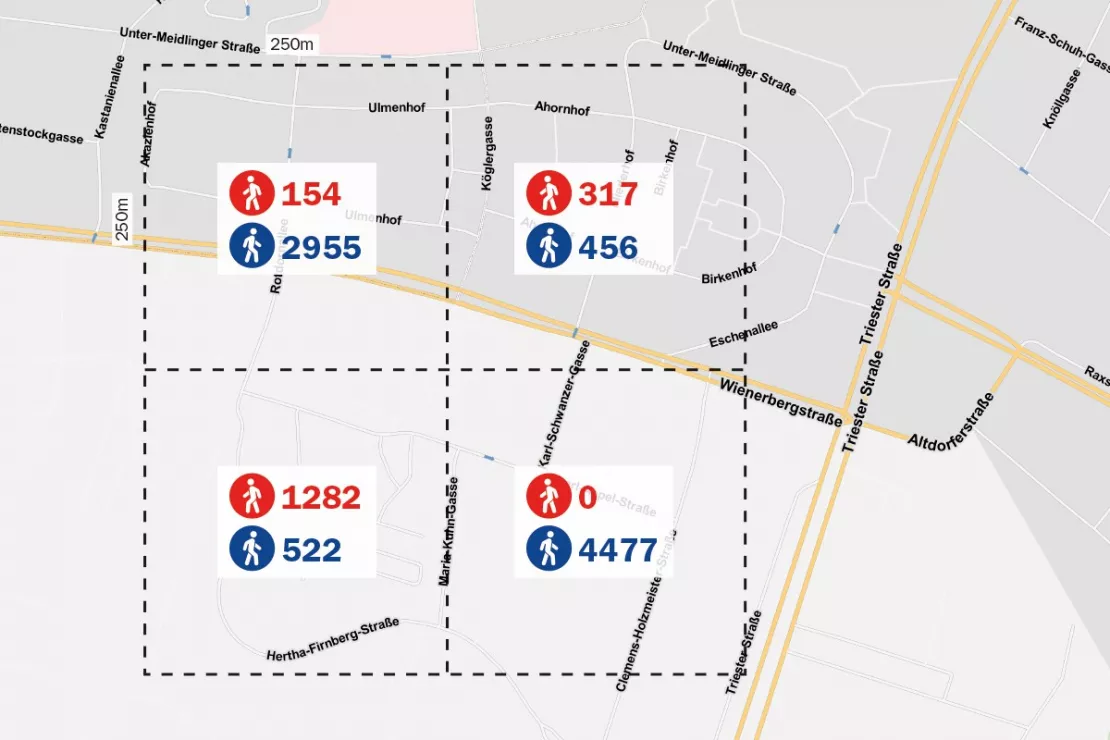
The map shows the absolute figures for working inbound commuters (blue) and outbound commuters (red) around Wienerberg in a 250 m grid.
In the top right cell, the inbound and outbound commuters are roughly in balance. This indicates a mixed use area (small businesses and apartments), which is usual in Vienna in districts from the industrial period. The large number of inbound commuters on the top left indicates a predominantly commercial area, while the bottom left is mainly a residential area. At the bottom right there are apparently no apartments, but larger office buildings.
Example 2: Hall in Tirol, Outbound Commuters (Employees)
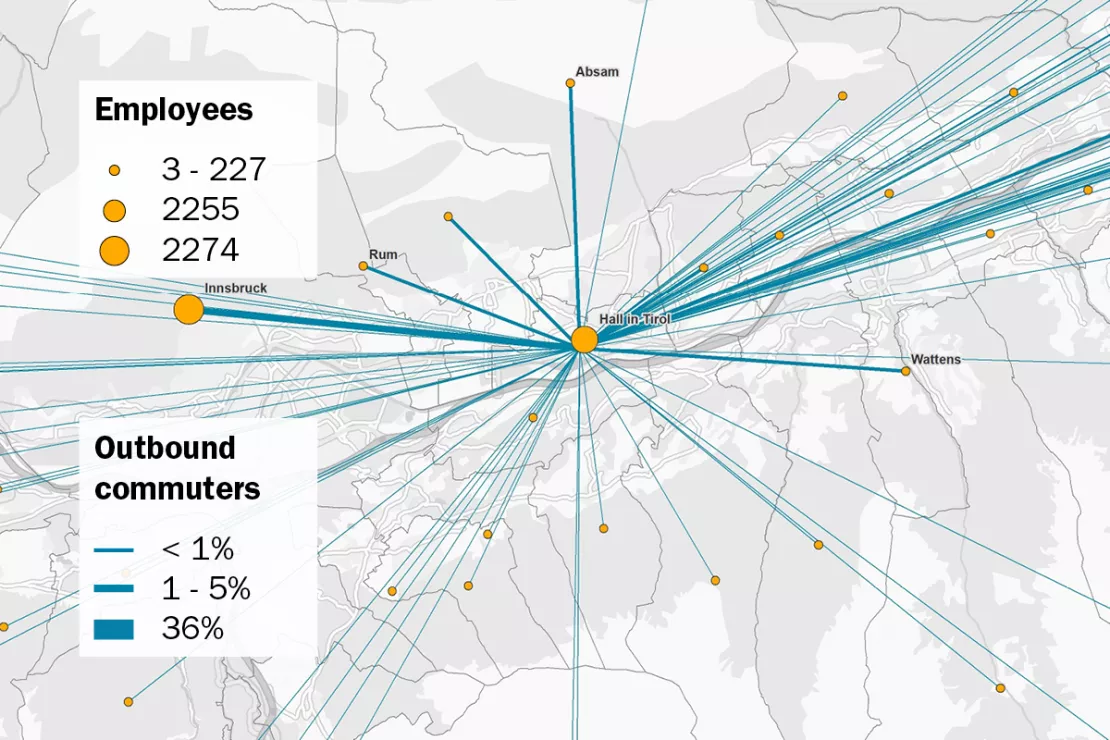
Here you see the commuter flows from the main residence in Hall, Tyrol to the respective workplaces at the community level. 35% stay in town, about the same number as commute to Innsbruck (36%). The thickness of the lines shows at a glance where the commuters mainly travel.
Example 3: Outbound Commuters (Students) in the Area around Laa an der Thaya
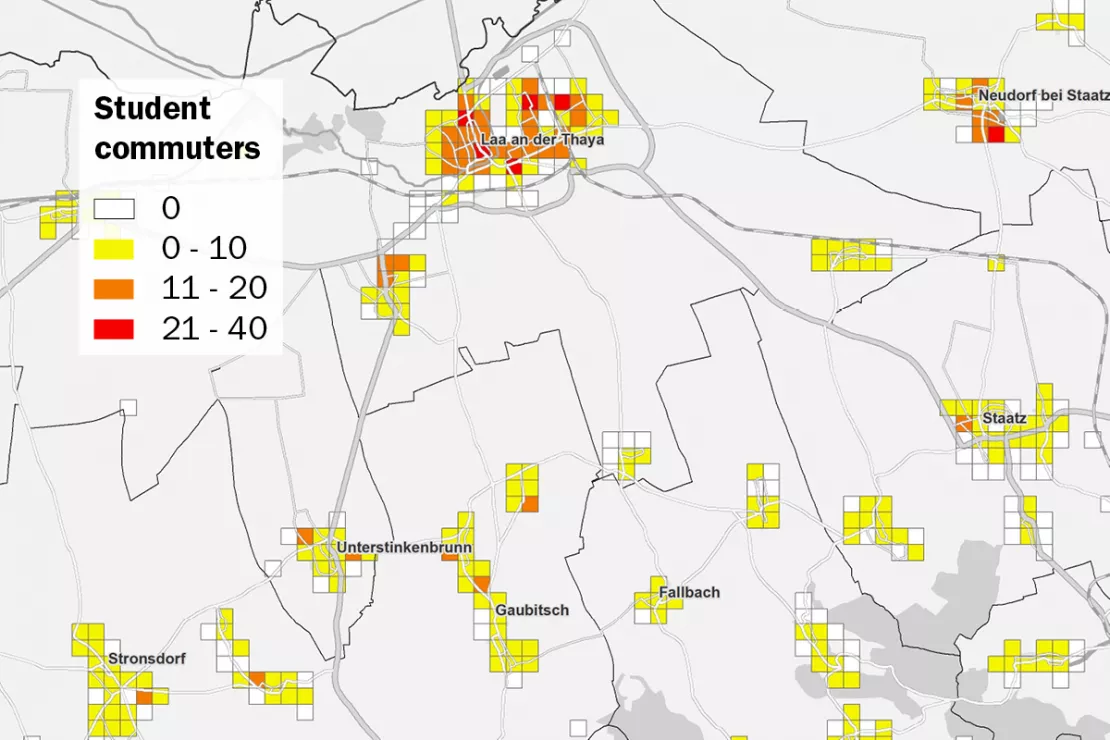
The map shows the number of students who commute to school from the villages around Laa an der Thaya at a 250 m grid level. The darker the cell, the more students that live there. As you can see, most live in the school town of Laa itself, because mostly families live there, information that can be incidentally deduced from the data.
It can be assumed that the students in Laa are so-called local commuters: The schools are located in the city. The map provides very detailed information, i.e. every student whose school is outside their own 250 x 250 m grid cell, appears as a commuter. If you want to know exactly where the students commute to, simply ask us!
Curious? See for yourself! Request your free test data today.
WIGeoGIS - Your Specialist for Demographics
At WIGeoGIS you not only get mobility data, but every conceivable socio-demographic data for Austria and the DACH-Region, as well as the rest of the world.
- Best price performance ratio
- 25 years of experience
- Independent
- Everything from a single source
We offer data from various providers, take care of the licenses and support you with the right software and consultation for your analyses.
Market data for Austria: Test now free of charge and without obligation!
- Test data* on demographics, purchasing power or other characteristics
- Non-binding, free test
- Test ends automatically without cancellation
- Receive test data* as Excel or shape file
I will gladly support you, also by telephone.
* Information about the free test data: Selected test data for Austria is available for districts in Vienna and the surrounding areas. The products of WIGeoGIS are intended for companies and are not suitable for private use. If you need a one-time market analysis, we will gladly make you a service offer.
Even More Data on Demographics, Purchasing Power and Companies in Austria
Demographics for Austria
You have access to the highest-quality market data for Austria. At every spatial level. WIGeoGIS integrates data from Statistics Austria into the basic geomarketing data products, updated annually.
B2B Addresses for Geomarketing
Company addresses with coordinates for direct marketing, sales management and location analyses

