Purchasing Power - A Key Indicator Among Market Data
Purchasing power data provides information on the consumer potential of a specific region.
Purchasing power data provides you with detailed knowledge of the level of prosperity and willingness to consume. They make it possible to get an objective overview of consumer spending by region, specific people groups and product groups.
Our Purchasing Power Data at a Glance
- Purchasing power in general
- Disposable purchasing power
- Per capita purchasing power
- Purchasing power for private consumer spending
- Purchasing power for everyday goods
- Purchasing power according to age, life stage and gender
- Purchasing power according to household size
- Retail-relevant purchasing power, eCommerce purchasing power
- Assortment-related purchasing power: 60 different product ranges
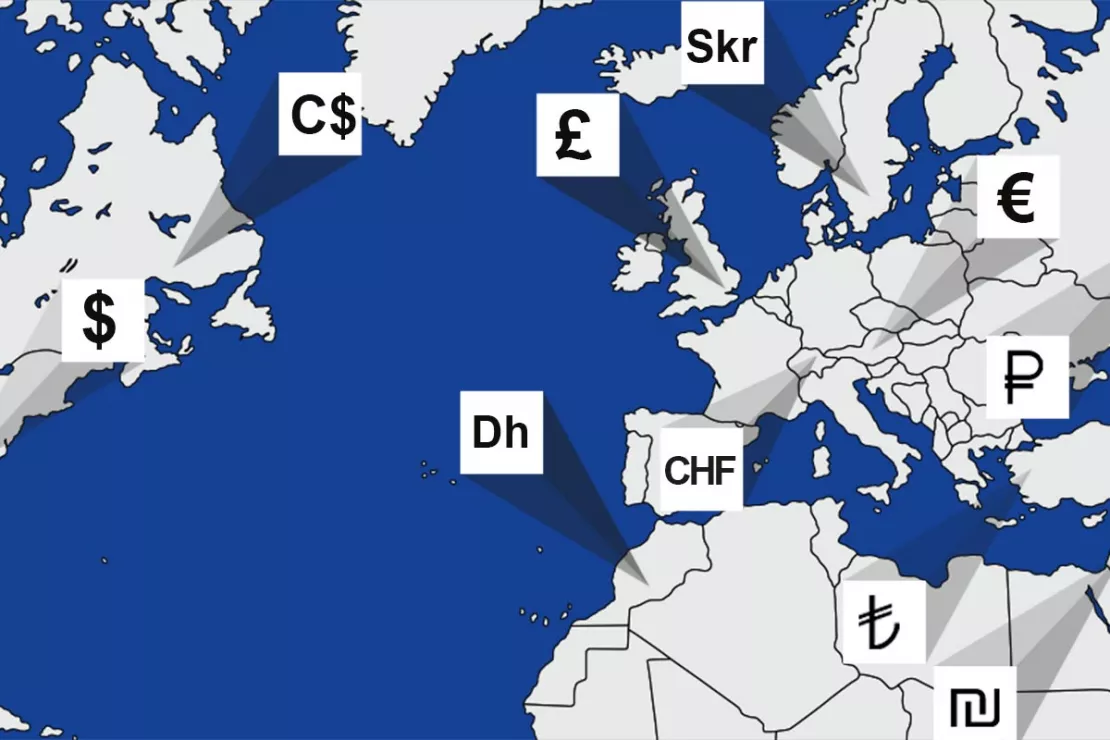
Purchasing power data by country, municipality, ZIP Code and even small-scale levels
You will receive up-to-date purchasing power data from us for over 40 European countries on the following spatial levels:
- Federal states
- City and rural districts
- Municipalities
- Zip Code areas (3-digit, 5-digit)
- and further levels, small-scale up to individual house
Worldwide purchasing power data is also available in smaller scales including the administrative, microgeographical and postal levels.
Examples of Our Detailed Purchasing Power Data
With small-scale data you know the purchasing power according to local conditions down to the very last detail. Small-scale data help you to better estimate the consumption potential of local residents. Classically, companies benefit from detailed purchasing power data for location assessment, branch network planning, advertising material planning as well as sales territory planning and controlling.
Purchasing Power in Germany - On a Small Scale
We offer you small-scale purchasing power data for Germany on the following levels:
- GEOmarkets: an average of 400 households in a coherent spatial unit
- Raster Cells in different sizes, e.g.
- 250x250 m (average 67 inhabitants)
- 100x100 m (average 22 inhabitants)
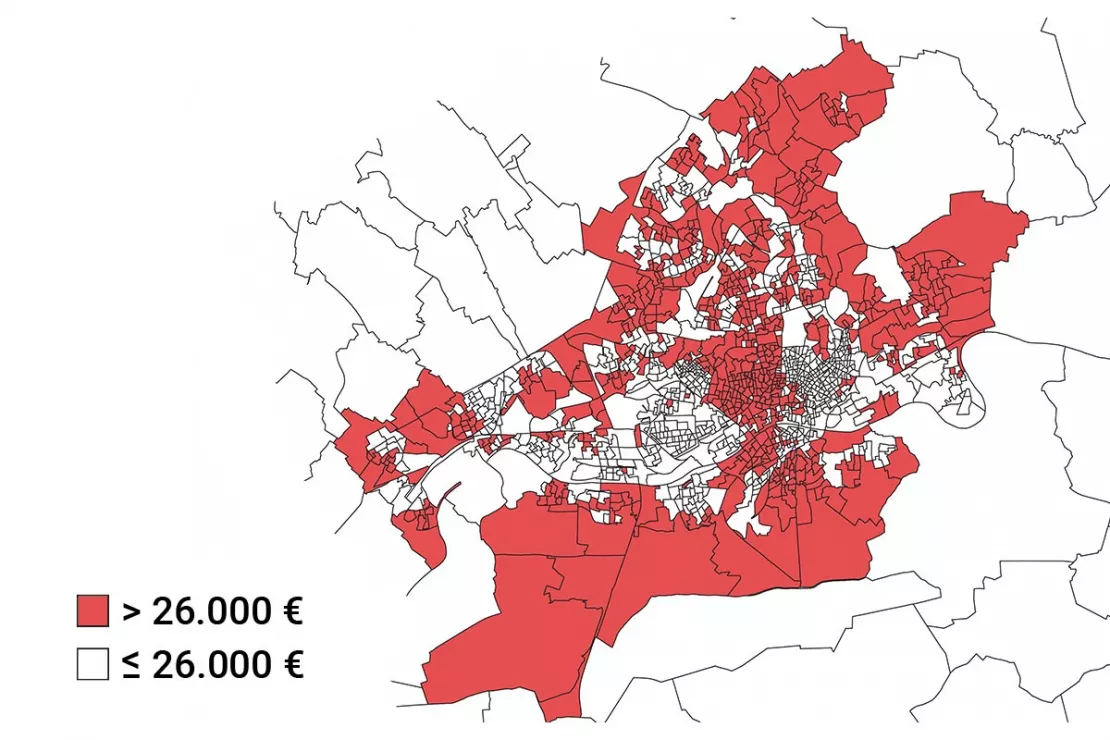
In the picture you can see an example of the spatial unit GEOmarkets, which represents the purchasing power in Frankfurt. It becomes clear how the high per capita purchasing power is spatially distributed in the city and what serious differences there are in the spatial distribution of purchasing power.
Purchasing Power Austria – Small-Scale
We offer you small-scale purchasing power data for Austria on the following geographic levels:
- Statistical enumeration districts
- Raster Cells in different sizes
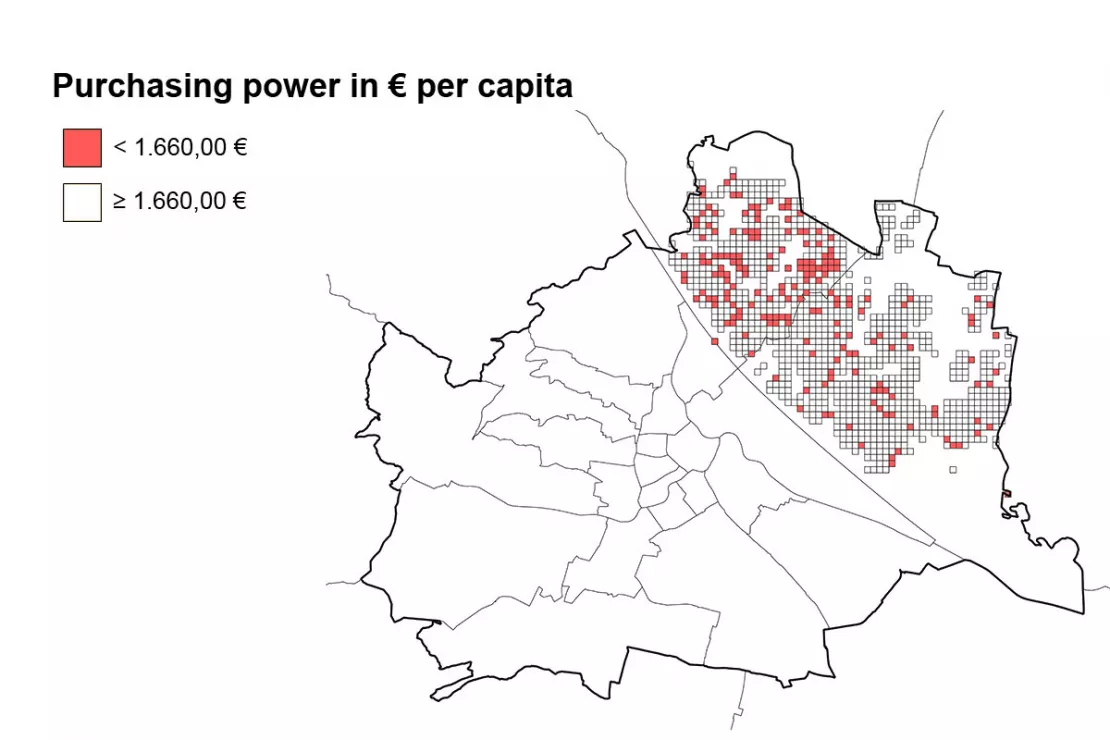
Looking at the 21st and 22nd districts in Vienna, you can see that the distribution of purchasing power in these growth regions is very different. Although the two districts have high purchasing power, the small-scale differences can be clearly seen on the map. Areas with low purchasing power (red) become visible.
Small-scale Purchasing Power Data Worldwide
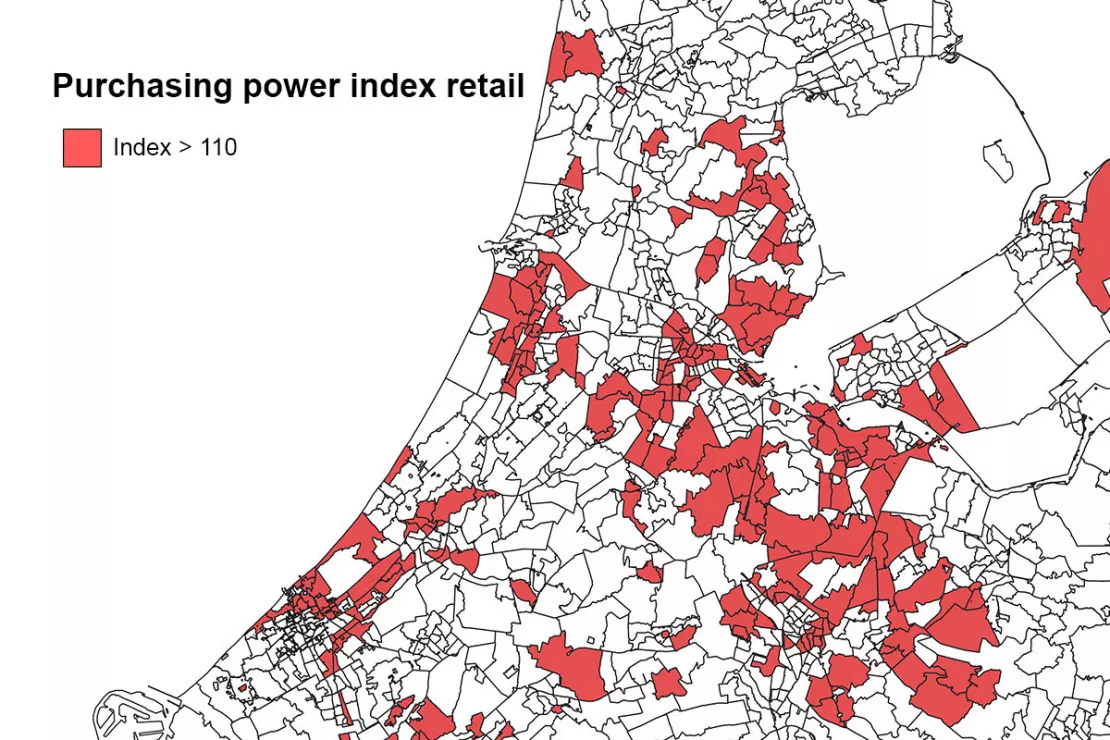
We have small-scale purchasing power data for most countries worldwide. We work with various purchasing power data providers, including local providers in the requested country. This ensures that we can prepare data of the highest spatial quality and deliver it to our customers. The purchasing power data visualized on the map comes, for example, from our data partner MB Research.
Are you interested in our small-scale purchasing power data? Request your free test data with no obligation!
Purchasing Power and Retail Data - As Varied as Life Itself
Purchasing power data and information on sales in retail and centrality are among the most important indicators of consumer behavior. Specific knowledge about purchasing power for analyses can be a competitive advantage. We explain the important differences.
Retail Centrality - Where do People Shop?
Retail centrality illustrates the attractiveness of a shopping location. For retail companies, details on the viability of a location as a shopping location are essential. Retail centrality is calculated based on the ratio of the retail purchasing power of the population to the total retail sales. This provides information about how well a retail location will be able to attract customers from nearby and further away.
Retail Sales - WHERE is HOW MUCH Purchased?
Retail sales means sales made in local retail stores. The purchases are recorded at the location where they are made. Retail sales are shown in euros per capita and as an index (national average = 100).
Online Purchasing Power for Retail
Online retail has become an integral part of our everyday life. As a result, online purchasing power has now become an important metric that companies should consider in strategy, expansion, location analysis, advertising planning and direct marketing. Because who buys what and how much where differs enormously not only at the country level, but also within each country.
Nobody knows this better than Wolfgang Richter, CEO of RegioData Research, “...there is a north-south and west-east divide in online purchasing power. For example, in the UK 26% of all consumer spending is online compared to just 4% in Bulgaria. But even within a single country, the regional deviations in terms of online purchasing power are sometimes very strong. It can be between 20 and 30%. There are also massive differences in terms of online purchasing power by product group. The most prominent example for Germany in this context would be that the online purchasing power for groceries is only 2%, compared to a whopping 30% for clothing and shoes.”
That is why we provide you with not only the general online purchasing power, but also the online purchasing power broken down into product groups. This data is available across Europe at the ZIP Code level and, depending on the country, also on a smaller scale.
Small-scale online purchasing power, examples
- Germany: ZIP Code and municipality level
- Austria: Zip Code and statistical enumeration district level
- Switzerland: ZIP Code and municipality level
- Italy: ZIP Code level and census data (Italy is divided into 400,000 areas)
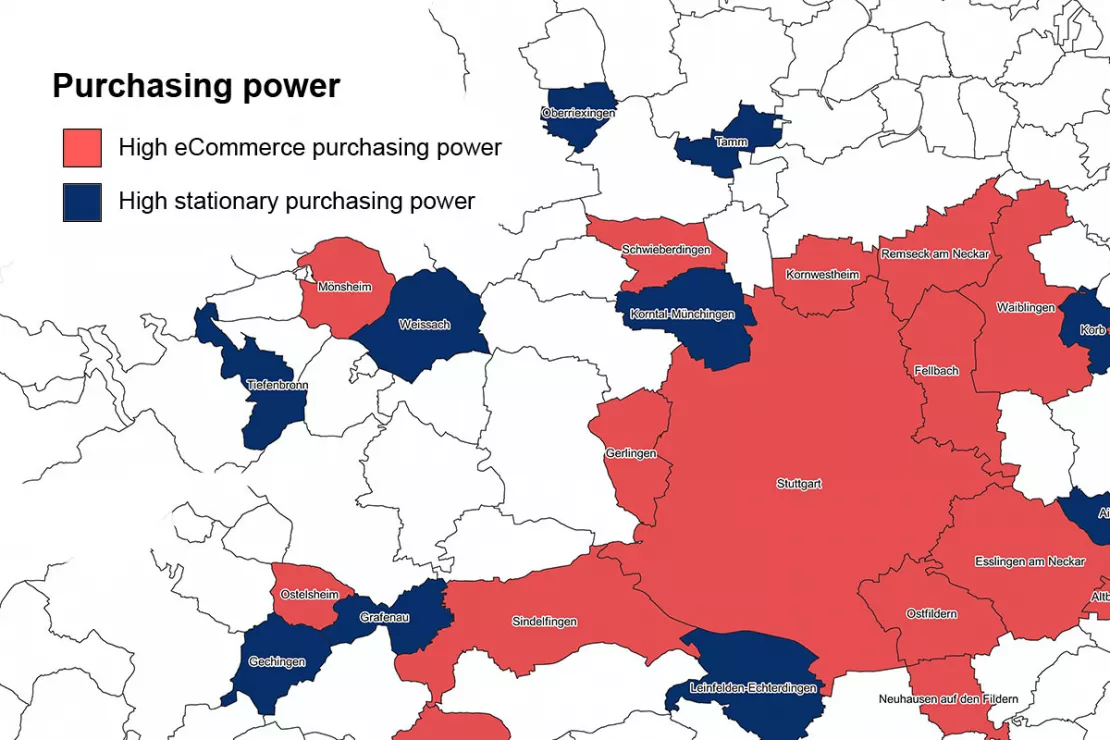
The regional differences are clearly visible on the map: Blue means high online purchasing power, while red means high brick and mortar purchasing power.
Not all Purchasing Power is the Same
Traditionally, and therefore most often, general purchasing power is seen as THE indicator for sales potential. This is due to the fact that special purchasing powers were previously only calculated for individual projects. It was very expensive. In the meantime, however, the methods for calculating purchasing power have become more differentiated. They make it possible to use a more precisely tailored purchasing power for the various products and questions without an expensive market research project.
Disposable Purchasing Power
A tailor-made purchasing power for example, is what is known as disposable purchasing power. Here is a practical example of disposable purchasing power: If a company sells high-priced consumer goods, one might think that high general purchasing power harbors high sales potential. However, this is only partially the case. It would be better to use disposable purchasing power here. Because this only includes that part of the disposable income that is available after deducting essential expenses. So, what’s left for consumption after the cost of housing and general living expenses are subtracted.
In many parts of Munich, for example, purchasing power is well above average, but at the same time a larger part of it is being consumed by the high rents and cost of living. If, however, not only the general purchasing power but also the disposable purchasing power is high, it is actually a promising sales region.
Purchasing Power According to Life Stage or Age Group
Another example of a tailor-made purchasing power is that according to life stages or age groups. For the developer of high-priced senior residences, it makes more sense to identify those regions in which wealthy people over 65 live who are already considering life in a retirement home, rather than everyone with high purchasing power in general who are currently not making such considerations due to their age. Here, the purchasing power according to life stage offers the much more accurate potential assessment.
International Purchasing Power Data
Income levels can vary greatly from country to country and from city to city. And with it the purchasing power. In order to make the purchasing power in different countries, municipalities, ZIP Code areas and sometimes micro-geographical spatial units comparable with one another, our data partner, MB-Research, prepares purchasing power data and so-called income quintiles, for example. Michael Bauer, Managing Director and Founder of MB-Research explains: “In addition to the international purchasing power data, we also use the concept of income quintiles and thus differentiate into five income classes. This shows how many households there are in each study area in the 20 percent with the highest income to the 20 percent with the lowest income in a country. The concept of income quintiles makes it possible to compare the areas within a country using an internationally standardized method, even if the countries differ greatly in terms of income levels, such as Switzerland and Romania. In addition, for international comparisons there are also twenty standardized areas and comparable categories for consumption expenditure. Furthermore, we offer even more differentiated product range and online purchasing power data, especially for Germany, which shows how high the expenditure in the respective product range is and how high the corresponding online purchases are.”
Worldwide
purchasing power data is also available in smaller scales including the
administrative, microgeographical and postal level.
Test our purchasing power data for free with no obligation!
Here are some of our purchasing power data highlights

Purchasing Power According to Life Stage
- Purchasing power 18 to 25 years (young adults)
- Purchasing power 25 to 45 years (prime of life)
- Purchasing power 45 to 65 years (established)
- Purchasing power 65 and older (senior citizens)

Product Range-Specific and Product-Related Purchasing Power
- Food, luxury foods and beverages
- Clothing and shoes
- Housewares and furniture
- Body and health
- Electronics
- Leisure, culture, entertainment
- Travel and vacation

Purchasing Power of the Wealthy
- Internationally small-scale on the administrative, microgeographic & postal level: Five income quintiles. This means that countries with very different income levels, e.g. Switzerland & Romania, are comparable.
- Additionally, for Germany at the ZIP Code and municipality level: Income classes based on net monthly income. The wealthiest income class has more than 7,500 euros net per month. In Germany, 3.5 million households fall into this income class.
- A small-scale representation is not possible due to data protection.

Purchasing Power for Everyday Goods
Everyday goods are an integral part of private consumer spending. They are bought routinely and without intensive preparation. They include food products (e.g. rice, sugar, flour) and hygiene products (e.g. toilet paper, soap, disinfectants)
- Purchasing power for everyday goods in € million
- Purchasing power for everyday goods in € per inhabitant
- Purchasing power for everyday goods - index

Purchasing Power for Financial Market Products
Banking products
- Active business (e.g. installment loans, mortgage loans)
- Passive business (e.g. sight deposits, savings deposits)
- Securities/shares (e.g. shares, fixed-income securities)
Insurance products
- Retirement provision
- Health insurance
- Property and casualty insurance
Test our purchasing power data for free with no obligation!
Your Benefits: Purchasing Power Data from WIGeoGIS
We are an independent data provider with many years of experience and work with various data providers. As a result, we know the data and license models of various suppliers down to the last detail and can find the ideal data and license models for you. We provide you with purchasing power data with a spatial reference, also as a time series.
Test our purchasing power data for free with no obligation! Simply fill out the contact form below.
Purchasing Power Data: Test now free of charge and without obligation!
- Purchasing Power Data for Germany or Austria*
- Non-binding, free test
- Test ends automatically without cancellation
- Receive test data* as Excel or shape file
I will gladly support you, also by telephone.
* Information about the free test data: Selected test data is available for standard regions in Germany or Austria. For Germany, the data is for districts in Munich and the surrounding areas. For Austria, the data is for districts in Vienna and the surrounding areas. The products of WIGeoGIS are intended for companies and are not suitable for private use. If you need a one-time market analysis, we will gladly make you a service offer.
FAQ
-
Can we get purchasing power data in formats other than Excel?
Yes, of course. We can deliver purchasing power data in any data format you require, for example CSV, Json or database.
-
Are time series for purchasing power data possible?
Yes! We can deliver purchasing power data over several years as a time series in the data format of your choice.
-
Why should I update my data regularly?
Population movement and data pricing has become considerably more dynamic in recent years. Therefore, an update is not only worthwhile from a content point of view, but possibly also financially.
-
Is the general consumer purchasing power the right choice in every case?
General purchasing power is often not the optimal basis for planning in every situation. It often helps to look more closely because consumer spending varies according to the life stage, regional habits and cost of living. We are happy to support you in the selection of detailed purchasing power information. This data includes retail-relevant purchasing power, purchasing power by product range and purchasing power by age group.
-
Do you have to license purchasing power data or is it available free of charge as open data from public statistical offices?
Complete and regularly updated purchasing power data on different spatial levels can only be obtained for a fee from private data providers. With very few exceptions, free, up-to-date purchasing power data is NOT available nationwide from statistical offices. For example, in the past, regional statistical offices in Bavaria and Baden-Württemberg offered purchasing power data, but mostly only at the city and district level.
-
Are there differences in the purchasing power of the various providers?
Yes, because the calculation does not follow any standard, but corresponds to the individual methodology of the respective provider. We know the purchasing power data of the different providers in detail and can provide professional advice to help you select the data that is best for you.
-
What is the difference between purchasing power and centrality?
Unlike purchasing power data which shows where potential customers live, information on the retail sales and retail centrality show the attractiveness of a shopping location, in other words where potential customers shop. For retail companies, details on the viability of a location as a shopping location are essential. Retail centrality is calculated based on the ratio of the retail purchasing power of the population to the total retail sales. Thus, it provides information on the extent to which local retailers are able to also attract customers from surrounding areas.
-
How does purchasing power data help to locate and target specific groups?
Specific assortment related purchasing power data and information on purchasing power by age bracket allow differentiated statements to be made about the regional sales potential of the population and help to efficiently plan locations, sales networks and advertising activities.

