Scoring Model for Location Analyses
Scoring analyses are ideal for evaluating locations quickly and clearly
Would you like to compare the potential of your locations with one another at a glance or see the potential for planned locations? With our scoring model, your location analysis will be as easy as reading a report card.
Why is the scoring model so well suited for location analyses?
If you use WIGeoGIS software to create a scoring model for your existing or planned locations, you can see their potential at a glance:
- As a result of the scoring analysis, each branch or location is given an overall score, in other words a number of points.
- The higher the number, the higher the potential of the branch in question. This allows the locations to be easily listed according to their potential and a location ranking can be created.
Now you can immediately see where your hotspots are, which potential locations make sense and which ones should be closed or upgraded.
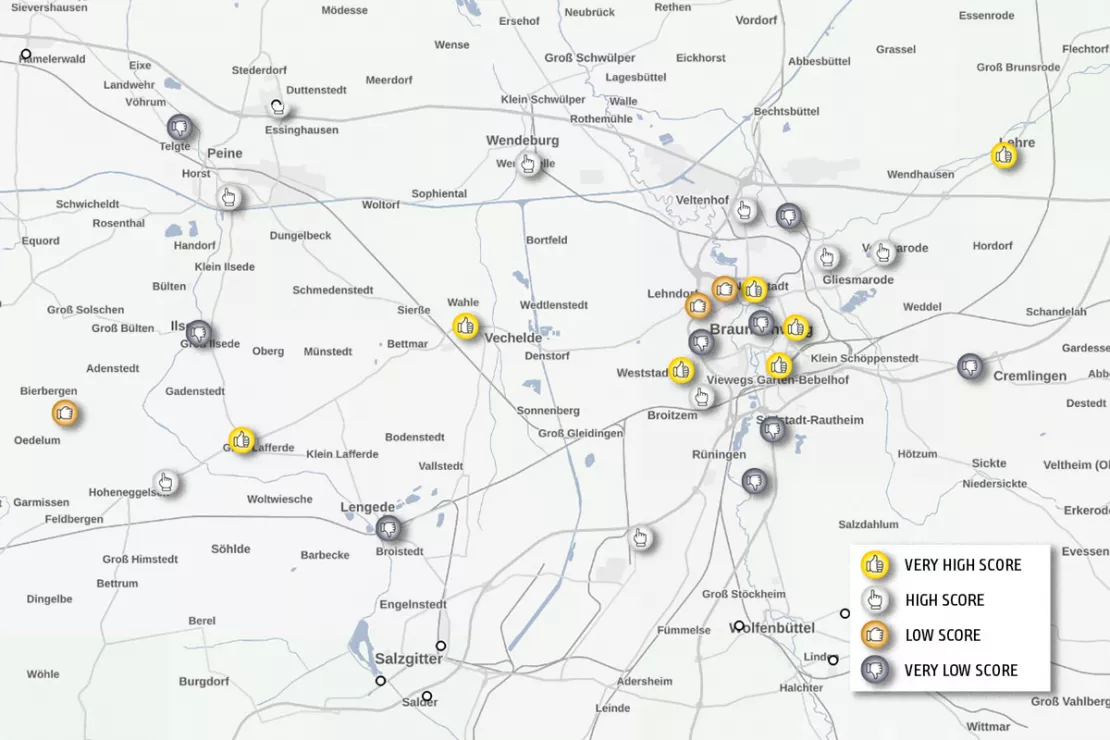
Advantages of the Scoring Model for Location Analysis
- See at a glance which locations have a little or a lot of potential
- Combine several location factors such as population density, daily population, number of competitors, location, area, accessibility, purchasing power, assortment, etc. into an overall score
- Compare the performance of existing locations with their potential
- See at a glance where branches are performing below their potential
- Quickly identify hotspots
- Implement a comprehensible model for your location analyses
We would be happy to show you scoring models for location analyses live
Find Hotspot Locations with High Potential
What happens in the background during the scoring analysis?
Each branch location is assigned a score or a comparison value in the form of a number. The value is created by determining and normalizing all the location factors that were previously defined in the GIS software and calculating a point value for each location.
Certain location factors are more effective than others for the potential of your locations. Which factors are best depends on the industry and the type of location. For this reason, the factors are weighted in advance (e.g. population potential 45%, purchasing power 25%, product range 20%, area 10%). This gives you a result that is optimally tailored to your individual location decisions.
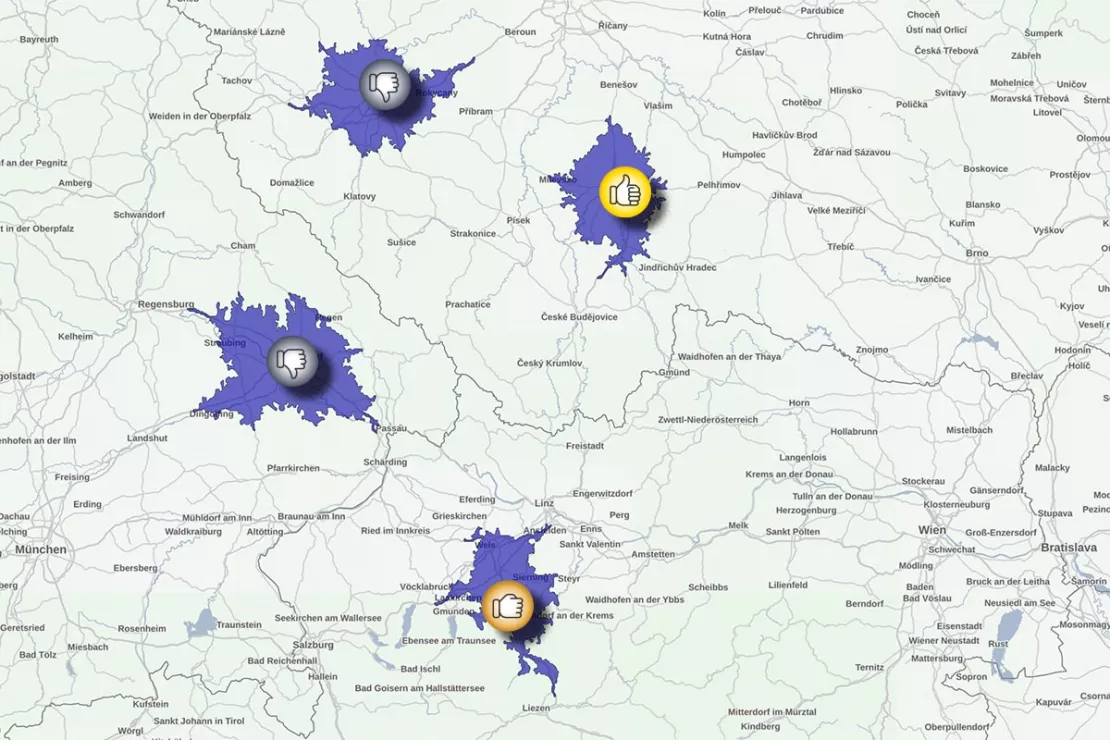
The information from the catchment areas (blue areas) is also taken into
account in the scoring models. Thanks to the uniform location assessment, the
potentially successful locations can be quickly identified.
Branch or Retail Networks: Comparison of Potential and Actual Performance
If performance indicators of existing branch or retail locations are available, they can be compared with the results of the scoring. An Excel table or matrix then shows which locations have low and which high potential and to what extent they actually achieve this potential. This makes it clear at a glance which branches are exploiting their potential and which locations are underperforming.
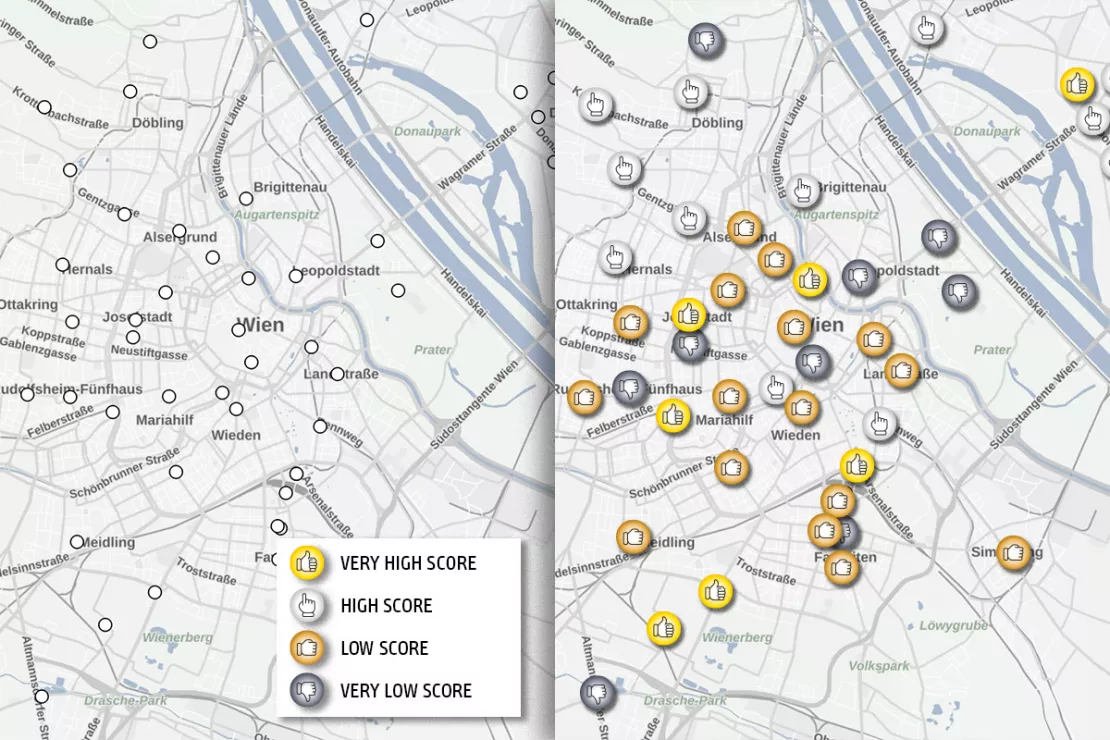
The scoring analysis can be used to identify good and bad branches or locations. Based on this information, you can decide whether branches should be closed, relocated or expanded.
Scoring models for location analyses are suitable for
- Potential analyses of planned locations
- Determining the market potential of existing locations
- Restructuring of retail or branch networks
- Planning of location expansions in new markets
We are happy to show you scoring models for location analyses and answer any questions! Free of charge, non-binding and free of obligation!
Application Example Scoring Analysis
A coffee shop chain with 10 branches in Munich wants to open another branch. There are three locations to choose from. In the first step, those responsible define those location factors that are important for their business and weight them:
- 50% for the number of people who live and work in the defined catchment area around the respective location, because this is the decisive parameter for a coffee shop
- 30% for the optimal connection to public transport
- 20% for stationary purchasing power
Now the score values of the individual location factors are calculated in the GIS software. The total results in an overall score for each location in the location assessment. For example, if one of the three locations has a score of 7, while the others only have a score of 5 or 3, there is nothing standing in the way of a new branch at this location.
You can find out more about other methods of location analysis and the optimal software here
Optimize Branch Networks with Geomarketing
Branch networks can be ideally optimized and reduced with geomarketing. Companies find branch locations for closures, relocations and openings.
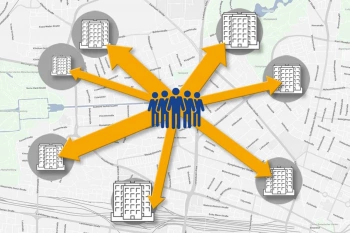
Perform a Location Assessment Using a Gravity Analysis
Gravity analysis provides a well-founded basis for your location assessment and sales forecasts.
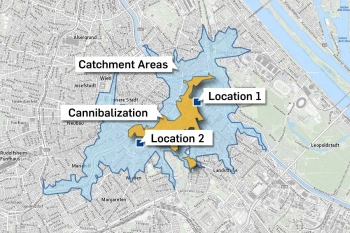
Calculate Cannibalization Rate Using Overlay Analysis in QGIS
QGIS plugin makes the cannibalization of two or more locations visible and shows how much business they are taking away from each other.
Scoring Model: Request a FREE Live Demo!
- FREE Live-Demo* of scoring analysis
- Non-binding, without further obligations
- Online presentation via video call
Do you want to know more about the scoring model for location analyses? I will be glad to support you.
* The products of WIGeoGIS are intended for companies and are not suitable for private use. If you need a one-time market analysis, we will gladly make you a service offer.
FAQ
-
What are the limits of a scoring model?
The scoring model is a simplified representation of reality by assigning a kind of overall score for each location. This score or number does not provide precise characteristics of a location. For example, if you identify a location as having high potential but it does not generate high sales, you have to look for the exact reasons why:
- Is the branch poorly managed?
- Is enough parking available?
- Is there too much competition nearby?
- Is a neighboring branch cannibalizing the business due to overlapping catchment areas?
None of this can be determined from the scoring model. A more extensive and deeper analysis is necessary for a more detailed assessment of the location.
-
How do I get a scoring analysis?
As a rule, the scoring model is created in a consulting project in which we at WIGeoGIS perform the scoring analysis in close cooperation with our customers. With our experience, the WIGeoGIS team can give you helpful recommendations, for example on the selection of location factors, and suggest how large or small you should define the catchment area for your scoring analysis. Alternatively, you also have the option of creating a standardized scoring model based on your needs in QGIS or the web application WIGeoLocation.
-
Can you also use scoring analyses to create sales forecasts?
The scoring model is only suitable for sales forecasts to a limited extent. In very general terms, if the scoring values are high, one can conclude that there is high sales potential. However, if you want to calculate the exact sales potential of your locations, we recommend that you perform a gravity analysis. The Huff gravity model calculates how the demand might be distributed across the different locations within a catchment area. The scoring model, on the other hand, always refers to the catchment area of a single location.
-
Who is the scoring model suitable for?
The scoring model is ideal for companies that are planning a new network of locations or want to restructure their branch network. With the scoring model, you can easily and clearly evaluate the market potential of the locations and compare locations with each other. This is particularly useful for the strategic planning of the location network, in other words when locations are to be closed or new ones opened.
Get to know Scoring model for location analysis now, for free with no obligation!

