Make Maps
Visualize Company Data Perfectly
With the WebGIS (Online GIS) WIGeoWeb, you can present your corporate world on the map - interactively and worldwide. You can see your customers, branch locations, employees, sales areas, competitors, sales, simply everything on the map.
What is an interactive map?
Interactive maps are based on digital map material, such as Bing Maps, TomTom and WIGeoStreet. Interactive maps are a core feature of WebGIS software (Online GIS). Interactive maps combine and display addresses and other geodata with company and market data.
Maps in a WebGIS are not static, but interactive. That means they change based on input from the user, for example if you select certain data for display, make a spatial selection or set a filter. In addition, the map section can be changed interactively (zoom or drill-in, drill-out).
Make Maps in WebGIS WIGeoWeb
WIGeoWeb is a state-of-the-art WebGIS (online GIS) that enables you to make maps. Once WIGeoWeb has been set up for your company, you can automatically create interactive maps using WebGIS. It is intuitive and easy to use.
Display Sensitive Data Securely and Privately on Maps
With WIGeoWeb, you can display sensitive data on the map without U.S. corporations “reading along”. For this reason, WIGeoWeb as an online GIS is also popular among industries with very sensitive data, such as banks, insurance companies and public authorities.
Tutorial - How to Automatically Create Interactive Maps with WIGeoWeb
Watch the video tutorial on how to work with interactive maps in WIGeoWeb and see what possibilities WebGIS has to offer (English subtitles).
Test WIGeoWeb FREE of charge and create interactive maps
Overview: Top Features of Interactive Maps
- Change scale: You can change the scale by drilling in or out on the map.
- Show and hide data: Using so-called data layers, you can show and hide different data one at a time or simultaneously.
- Turn labels on and off for cities and regions: On the map, you can show and hide the names of cities, districts, and countries. You can even label sales areas (e.g. the name of the sales representative) which can then be shown or hidden.
- Interaction between map and table: The map and table interact with each other. For example, if you make a spatial selection by drawing a circle on the map, the data in the table will update. It will display only the data from the area selected on the map.
- Interaction between table and map: If you select data in the table with a checkmark, only that data will be displayed on the map. The WebGIS will hide all the other information on the map.
- Interactive printing: Select exactly the area of the map you want to print. To select the print area, draw a window exactly around the area you want to print.
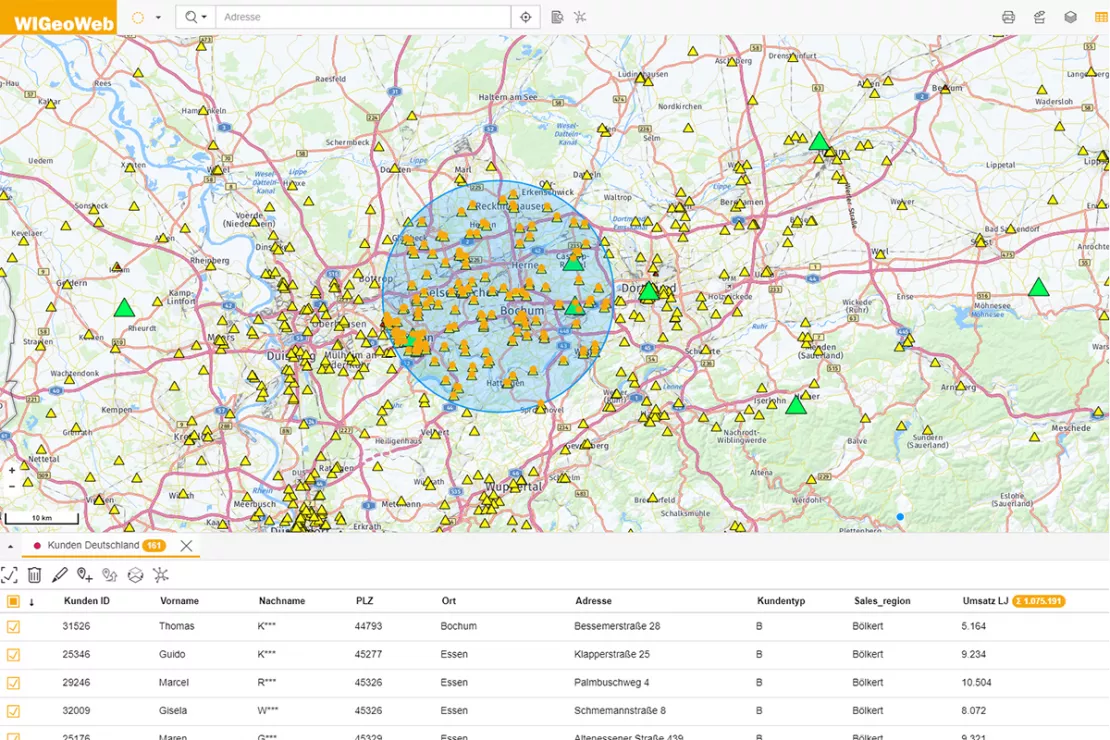
Digital maps offer a variety of interaction options, allowing you to work intuitively and playfully with the WebGIS WIGeoGIS.
Make Maps with WIGeoWeb
Interactive Maps - Examples
A “Classic” Among the Interactive Maps for Companies
Key company data can be ideally displayed in online GIS. When companies start using a WebGIS, they usually start by creating the following thematic maps, which remain a long-time favorite even after years of use:
- Branch Locations on the Map
- Customer Map
- Employee / Sales Representative Map
- Turnover on the Map
- Competitor Map
After the introductory phase, companies usually want to display even more detailed and comprehensive data on the map. They move from pure visualization and interaction with data on the map, to data analysis with WebGIS.
Customer Data on the Map
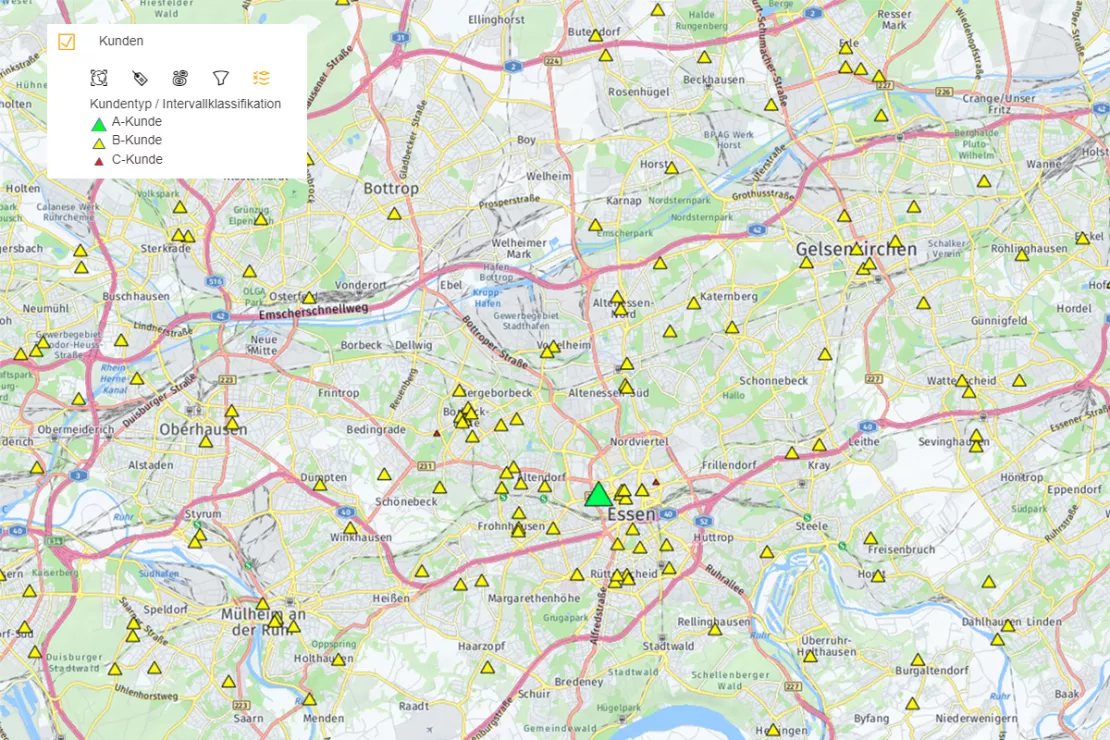
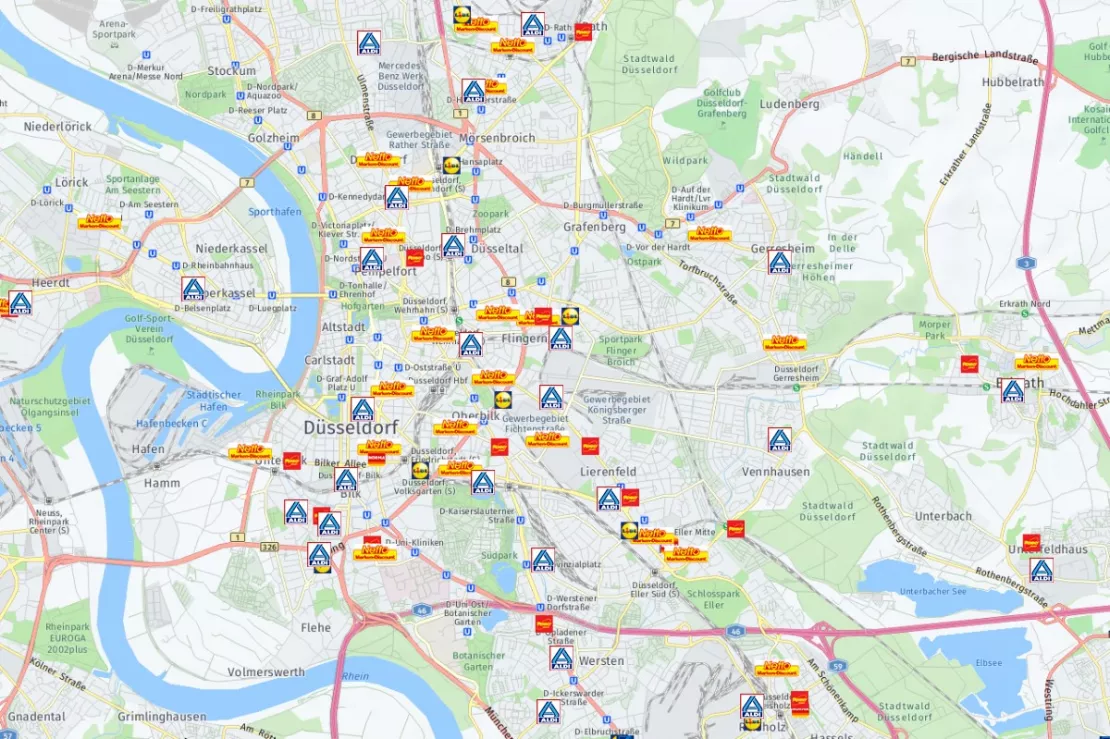
Display all your customers, or just a selection such as A, B, C customers, interactively on the map. You can see the distribution and scattering in an area. Each point represents the address (location / place of residence) of a customer.
Branch Locations on the Map
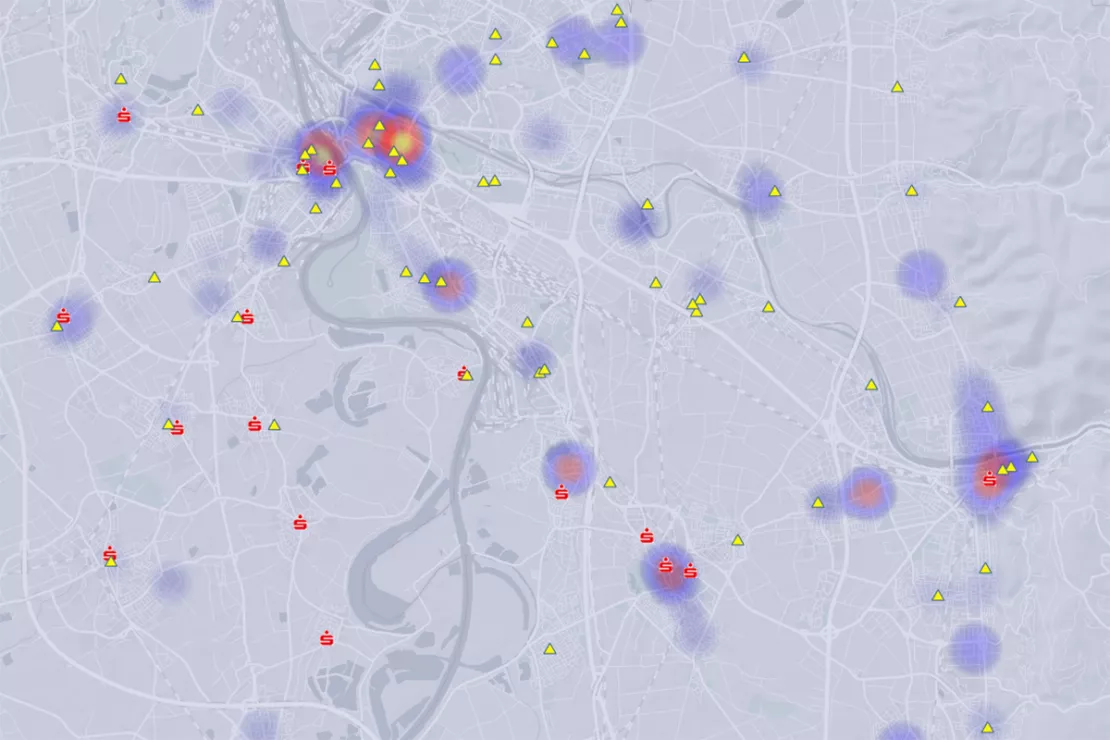
Display your global business locations on the map, together with your customer density:
- Branches
- Dealers
- Sales Partners
- Service Centers
- Warehouses
- Logistic Hotspots etc.
Sales by Sales Area
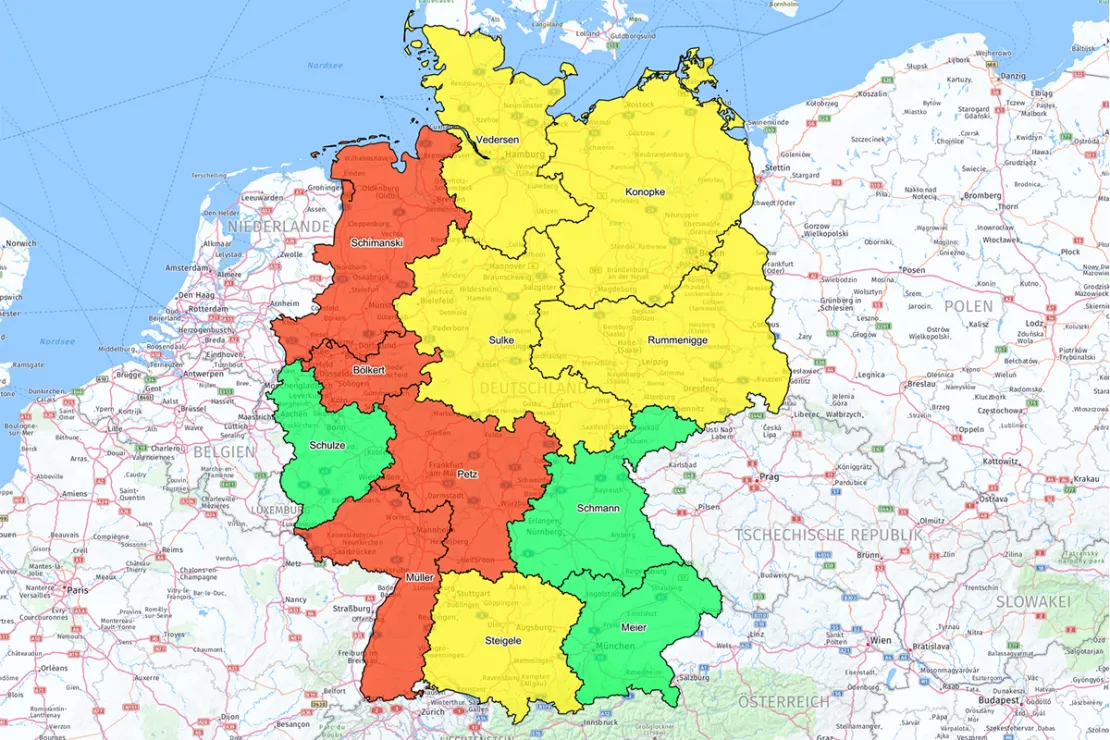
Take a look at your sales figures. How is the business doing globally, in Europe, regionally? Depending on the area of responsibility, you can display sales figures and go into even more detail. This not only applies to sales by area, but also by division, product and for any KPI that you would like to analyze and see on the map.
Competitors on the Map
Take a look at where your competitors are located. How are they distributed in the area compared to you? Display your locations, sales representatives, customers and competitor locations all at the same time on the map.
5 Reasons for Using and Making Maps with WIGeoWeb
Everyone uses map applications in their daily life and is well aware of the benefits they offer. Even companies benefit enormously from the creation of interactive maps. Here are the five main reasons:
1. Visualization of Data
Of course, data can be displayed in diagrams and graphs. At the same time, the map shows you another dimension, that of space. That is why on a map, you can see more information at a glance. 80% of company data has a spatial reference. You can take that into account when analyzing data geographically and creating interactive maps.
2. Everything at a Glance with Just a Few Clicks
With interactive maps, you can quickly and easily capture any desired perspective on your data, whether you want to get an overview of your entire area of responsibility or have a close look at the fine details.
3. Interaction with Data
The interactive map is the ideal tool for working with your data. With drill-in and drill-out, you can zoom in on the map. You can choose to display data on divisions, products, areas or market data separately or at the same time. Intersect data. Spin and flip your data however you like. The variety is almost unlimited.
4. Intuitive Operation
Digital and interactive maps are easy and fun to use. Just a click, and you see the data on the map. Every step is easy to understand and undo. Data analysis and data visualization in WebGIS maps is fun.
5. Display Sensitive Data Securely and Privately on Maps
Honestly. Have you ever looked up a customer address or location information with a free map application, despite the risk that others might be able to “read along”? With WIGeoWeb as a WebGIS, you can confidently make maps from all your data, no matter how sensitive it may be. In WIGeoWeb, your data is secure and private.
Discover all the functions and possibilities WIGeoWeb has to offer!
These Companies Already Use and Trust WIGeoWeb
Take a Look at Our WebGIS Case Studies

Unicredit Bank Austria: Geomarketing optimises sales structures
Using WIGeoGIS geomarketing software, UniCredit Bank Austria is optimising its sales structures based on physical branches.
Geomarketing for direct marketing at Österreichische Post
Direct marketing stands for as little wastage as possible, yet the demands of customers on distributors of direct-to-household advertisements are increasing.
VDMA - WebGIS supports tractor manufacturers
VDMA Agricultural Machinery uses WebGIS to support tractor manufacturers with geomarketing analyses for the optimization of sales and service structures.
Make Maps: Fill out the form, test it free of charge & without obligation!
- Non-binding, free test for 30 days
- Test ends automatically without cancellation
- An employee will explain the tool in a short webinar*
* Information about the free test access: Standard regions with selected data in Germany or Austria will be made available. In Germany, these regions are districts in Munich and environs, and districts of Vienna and environs in Austria. The products of WIGeoGIS are intended for companies and are not suitable for private use. If you need a one-time market analysis, we will gladly make you a service offer.
FAQ
-
Can I create an interactive map for all of Germany with WIGeoWeb?
Yes! With WIGeoWeb you can create interactive maps for all of Germany and also for every other country, region, city and the entire world.
-
Can I create interactive maps free of charge with WIGeoWeb?
Once you have licensed WIGeoWeb, you can create as many interactive maps as you want for free.
-
Can I create overview maps with WIGeoWeb?
Yes! With WIGeoWeb you can create interactive overview maps of any regions and sections of a map. From micro-locations to municipalities and cities, ZIP Code areas, sales territories, retailer areas, countries, etc. Everything is possible.
-
How can I create interactive maps with WIGeoWeb free of charge?
You require a license to create interactive maps with WIGeoWeb. In WIGeoWeb, users can choose from ready-made interactive maps and view them with different content, data and analyses. As an administrator, you can create new analyses and templates that can be used as interactive maps.
-
Can I use WIGeoWeb to create an interactive map for my website or homepage?
In principle yes, but we have more suitable solutions for this:
- On the one hand you have our “Nextdoor” solution. Nextdoor can serve as a store finder tool on your website. You can also use it to make other places visible on the map, for example sights in your city, restaurants and bars, schools, sports facilities and much more. Your website visitors can use the map interactively.
- On the other hand, you have our WebGIS solution that can be tailored with precisely the information and functions you need for your website. One example of this is the AT Broadband Atlas project.
-
Does WIGeoWeb use Google Maps to create the interactive maps?
If you explicitly want Google Maps for your interactive maps, we can set this up accordingly in WIGeoWeb. However, you must then agree to the Google license models for data usage. WIGeoWeb generally uses other map providers, such as Bing Maps, Here, OpenStreetMap, TomTom etc.
-
Can I create interactive maps from an Excel file?
Yes! You can upload Excel files to WIGeoWeb and use this data in the interactive map for analyses and data visualization. If the data contains addresses, WIGeoWeb automatically geocodes the addresses.
-
Can I create interactive city maps with WIGeoWeb?
Yes, see question 1. With WIGeoWeb you can create any number of interactive maps for any area, including a city.
-
Does WIGeoWeb use the open source GIS QGIS to create interactive maps?
You can make data and analyses that you have created in QGIS available online to a user group of any size via WIGeoWeb. Access rights are controlled through a role management system. WIGeoWeb has an interface for QGIS so that you can easily import data from QGIS into WIGeoWeb at any time. You can also export data from WIGeoWeb into QGIS.

