Demographics for Austria 2025/2026
WIGeoGIS delivers demographics from various providers all from a single source: Population, age, purchasing power, as well as hundreds of other characteristics. But only up-to-date data can provide optimal results for your market data analyses. That is why we update our data annually.
Why Up-to-Date Data is so Important
New homes are being built, especially in urban areas, which are characterized by an influx of population, while people are moving away from rural areas. So not only the population numbers, but also the age and purchasing power change. With geomarketing you can find target groups and analyze market penetration. In a quickly changing world, optimal results can only be achieved with demographic data that is up-to-date.
WIGeoGIS provides market data from various providers and prepares them for spatial analysis. And we work extremely hard to ensure our data is up-to-date, because we want your market data analyses to increase the success of your company!
Test our Demographics for Austria for free with no obligation!
Did you know, ...?
- …that in the 9th district of Vienna, the percentage of people between the ages of 20 and 24 is particularly high?
- ... that Warth in Vorarlberg is the municipality with the highest proportion of large households?
- …that the municipality of Ostermiething in Upper Austria has the highest percentage of industrial and warehouse buildings?
- …that the cities of Graz and Innsbruck have the highest percentage of people between the ages of 31 and 50 living in single-occupancy apartments?
- …that in the 1st district of Vienna, the municipalities of Fiss in Tyrol, and Gießhübl in Lower Austria, the percentage of executives is particularly high?
These and many more questions can be answered with our up-to-date demographics.
Demographics Austria - Over 100 Attributes Updated Every Year
Visualized on maps, you can see the answers at a glance! Here are a few examples.
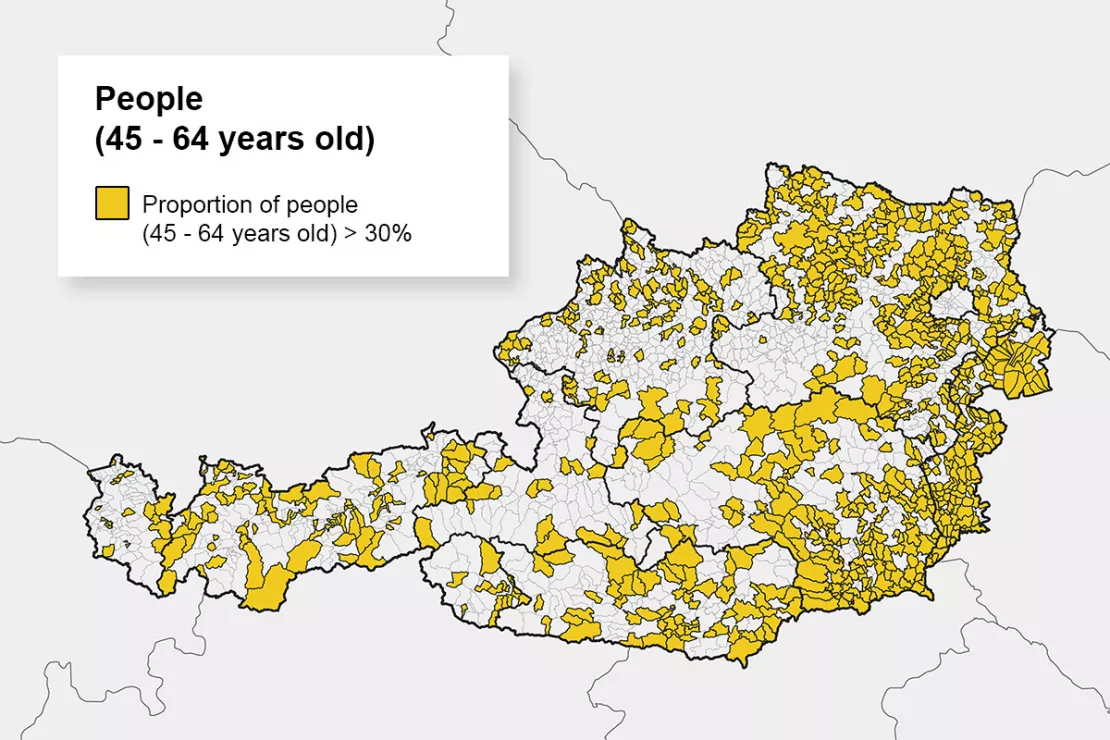
Where do a particularly large number of people between the ages of 45 and 64 live?
The 45 to 64 age group is a particularly interesting target group for geomarketing, as they often have high incomes, stable living conditions, and strong purchasing power.
Each age group has specific needs and preferences. Such analyses enables companies to tailor their offerings to their respective target groups.
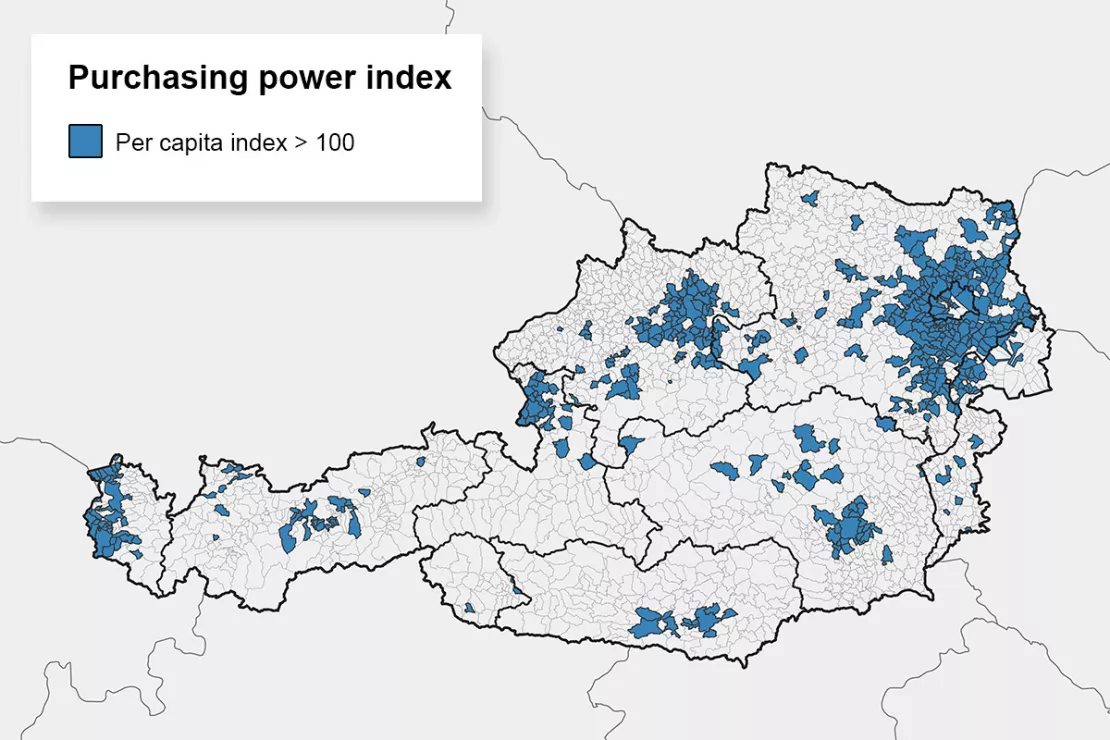
Where is purchasing power highest?
Purchasing power is one of the central analysis indicators in geomarketing. The map shows municipalities with an above-average per capita purchasing power index (Austrian average = 100).
Are you interested in Demographics for Austria? Request test data with no obligation.
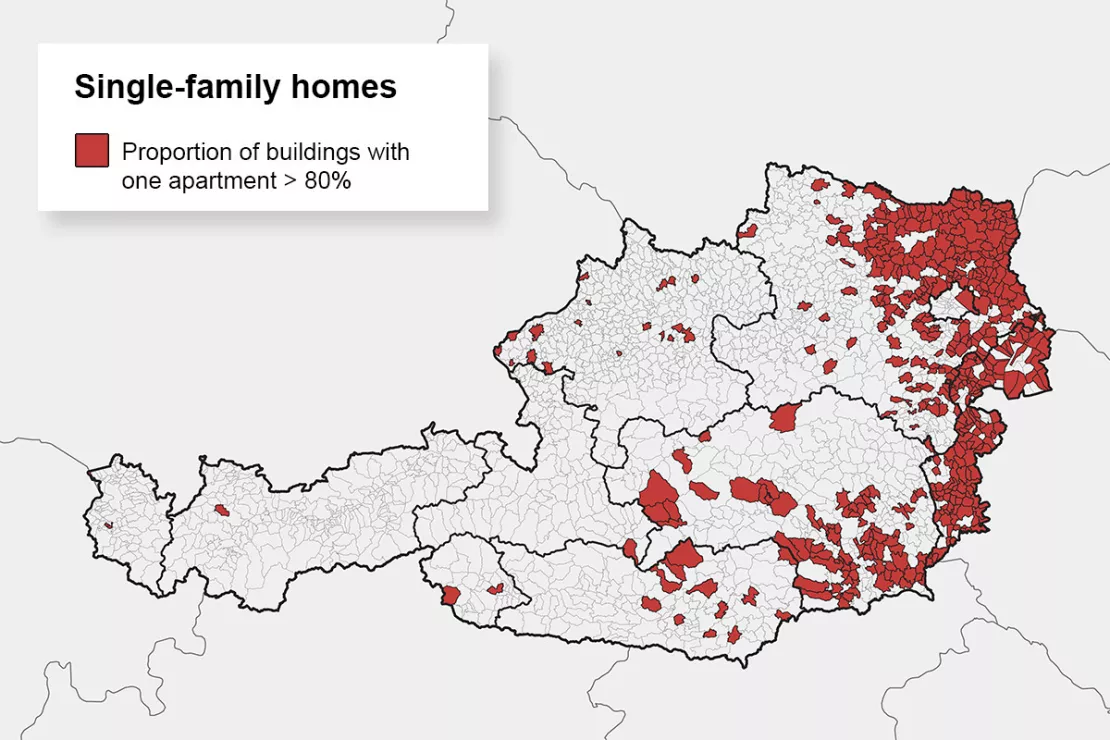
Where are there a particularly large number of buildings with only one residence?
The red areas depict municipalities with a large number of single-family homes, in other words, a high percentage of buildings with only one residence. This indicator is particularly pronounced in the eastern regions of Austria.
Where can you find a high number of managers in Vienna?
The map shows the share of managers in Vienna's total population. Managers particularly prefer residential areas in the center of Vienna and near the Vienna Woods and the Danube.

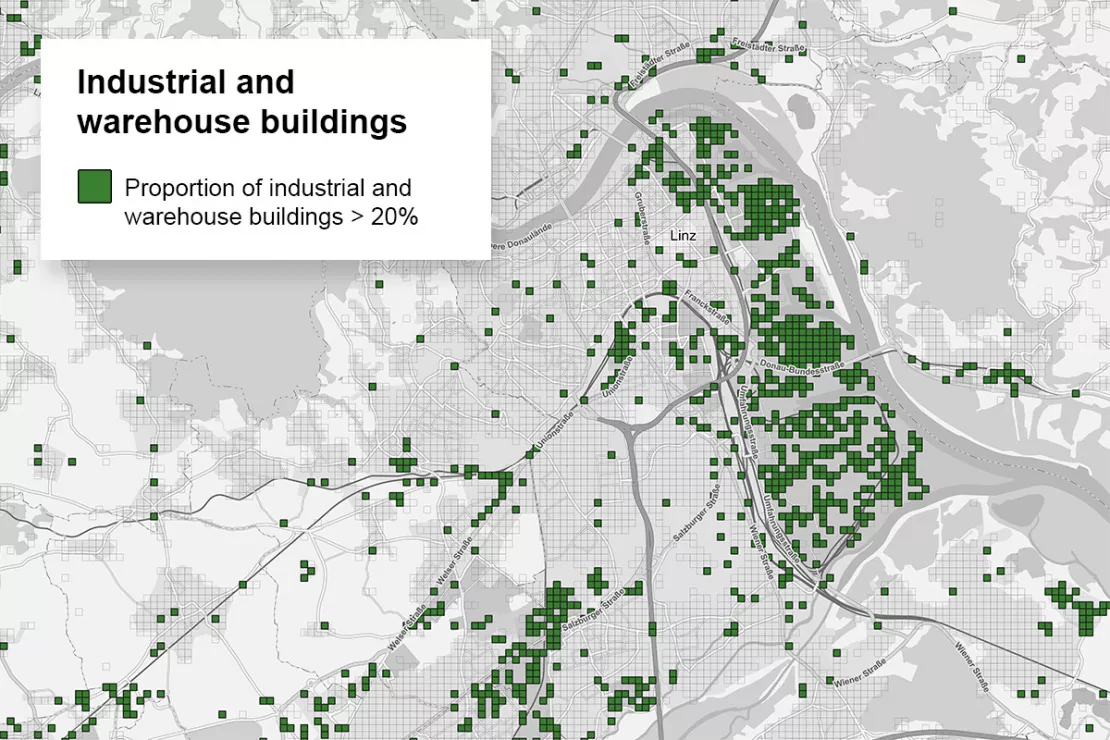
Where are there a particularly high number of industrial and warehouse buildings in Linz?
Linz is known as an industrial city and is one of the most important industrial locations in Austria. The map shows where the percentage of industrial and warehouse buildings is particularly high.
For this visualization, small-scale grid cells of 100x100 meters each are used.
With up-to-date market data from WIGeoGIS you will find your target groups and market penetration!
Why You Are in Good Hands with WIGeoGIS When You Need Demographics
- We are independent: We do not produce demographics ourselves, but sell data from a wide variety of providers. We are networked with every imaginable provider and have an eye for quality. As your consultant, we are committed only to your success!
- Best price performance ratio: Depending on your requirements, the prices of different providers can vary greatly. We know regional data well and can find you the best possible offer!
- 25 years of experience: You do not know which spatial level is the most suitable for your market data analysis? Just ask us! We have been working with spatial data for a very long time.
- Everything from a single source: If you need data from more than one provider, we are your single source for all your data needs. We also take care of the licenses. That makes things easier for you. And if you require them, we also have attractive market analysis tools or GIS software for your analyses and will be happy to help you find the solution that is best for you.
Demographics Austria: Test now free of charge and without obligation!
- Test data* on demographics, purchasing power or other characteristics
- Non-binding, free test
- Test ends automatically without cancellation
- Receive test data* as Excel or shape file
I will gladly support you, also by telephone.
* Information about the free test data: Selected test data for Austria is available for districts in Vienna and the surrounding areas. The products of WIGeoGIS are intended for companies and are not suitable for private use. If you need a one-time market analysis, we will gladly make you a service offer.
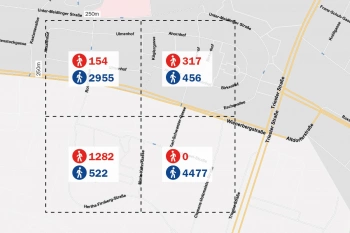
Mobility Data Austria
Mobility data for location analysis, traffic planning, demand planning for Austria. Small-scale and up-to-date. Inbound and outbound commuters on a 250 m grid.
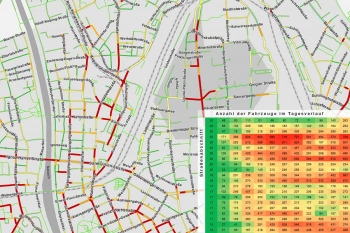
Traffic data for Mobility analysis & Traffic Planning
Use detailed traffic data from TomTom via WIGeoGIS for precise mobility analyses, traffic planning, and location analysis.
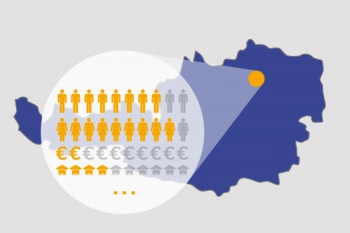
ArcAustria – Demographic Market Data for Austria
Population statistics, age groups, and over 100 indicators – available at multiple geographic levels. Updated annually.

