Enter, Edit, Display and Use Data
With the WIGeoWeb software, companies can accurately enter a treasure trove of data!
Enter your data into a tool that takes care of all your data maintenance and editing challenges at once: enter data, edit data, display data, use it directly with your colleagues and optimally visualize everything on a map.
Successful companies make decisions based on modern data analysis. Accurate data entry and data maintenance are the greatest challenges for many companies. With WIGeoWeb, data chaos due to inaccurate and incomplete addresses or the assignment of areas to the wrong ZIP Code are a thing of the past.
Enter your data as points on a map (addresses, locations), lines (pathways, streets, power lines, etc.), areas (ZIP Code areas, municipalities, sales territories, etc.) and prevent data chaos right from the start.
Advantages of WIGeoWeb
1. Enter data: e.g. addresses, streets, catchment areas, sales territories: automated, via upload and on the go with a tablet directly on site
2. Edit data: add attribute information, e.g. names, characteristics, socio-demographic data and more
3. Display data: in tables and visually on an interactive map
4. Use and share data: view and analyze visualized data and make it directly available to colleagues (e.g. as an Excel file or via email)
1. Enter Data Immediately and Accurately
A matter of course with WIGeoWeb!
Unnecessary errors often occur when entering data. Classic example: the sales representative visits a new customer and does not enter the data immediately on site, but afterwards in the office when some data may be forgotten. Another example: When visiting a branch, the sales representative discovers that a competitor has opened a location across the street. They do not immediately enter it into the database. In the office they accidentally enter the wrong house number. It is tedious and time-consuming to correct such errors afterwards. This is exactly where WIGeoWeb makes a decisive difference compared to other data entry tools. Because the data is recorded on the basis of geographical and geometric information. Data + geospatial information = Geodata.

Would you like to enter points, lines and areas on a map?
Points on a Map: Enter Addresses, Branches Locations, Competitor Locations, etc.
You probably know the famous points and pins on Google Maps. These points are geospatial data, more precisely point data. A so-called geocoding software determines the X/Y coordinate for the address you enter. With this coordinate, the software can display the address as a point on the map. And that is exactly what WIGeoWeb can do without you having to disclose your data to a U.S. company. You enter your data securely and unviewable by others on a server in Austria.
Using Point Data - Example
The most common way businesses use point data relates to addresses:
- Customer maps: Where are my customers located?
- Maps with company locations: Where are my branch locations and warehouses?
- Maps with competitor locations: Where are my competitors and how close are they to my locations?
- Maps with bike racks at train stations: Where and how many bike racks are there at train stations?
- Where are parking spaces with charging stations for electric cars?
- Where are the locations of advertising pillars, billboards and other out-of-home media?
- Calculation of risks: Is a single-family house to be insured in a high-risk area, for example a flood zone?
Entering Point Data: Maximum Freedom of Choice with WIGeoWeb
You can import addresses and locations (= point data) in many ways with WIGeoWeb:
- via API interface
- Upload (e.g. as an Excel file)
- Manual entry
- Mobile data entry on site with a tablet

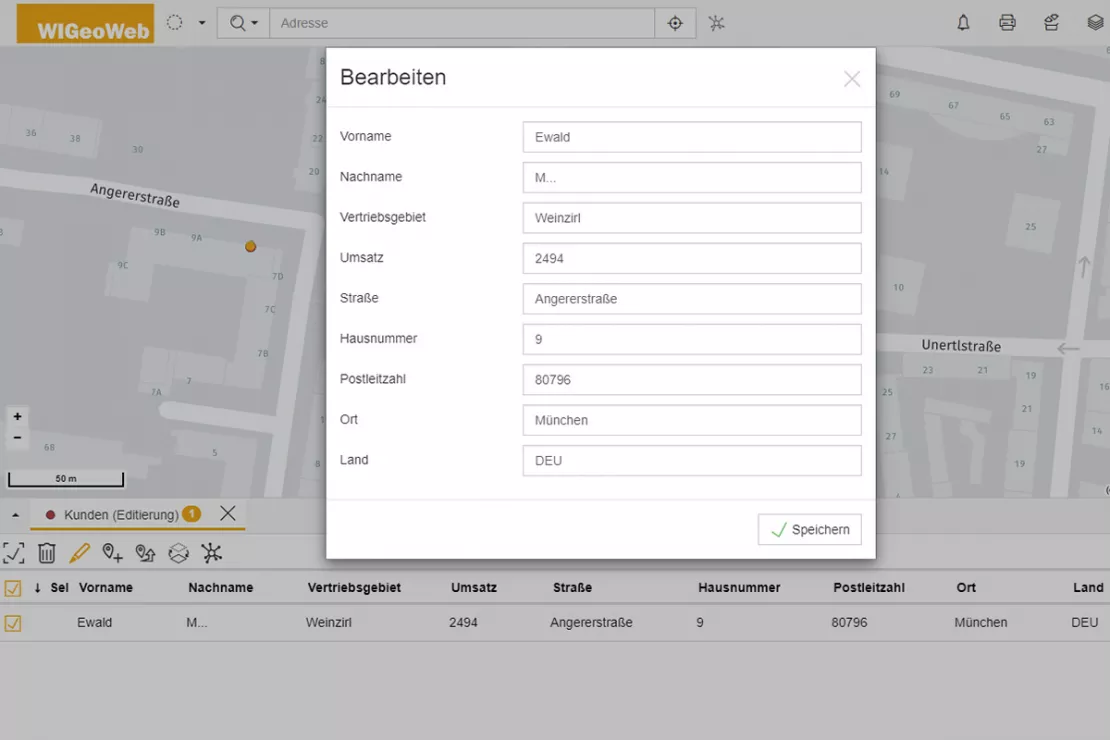
Mobile data entry? Of course! With WIGeoWeb you can enter point data, such as addresses and locations, directly on site. Simply tap on the symbol with the cross hairs and you will immediately see your location on the map. You can move it if necessary. Add the necessary information and save it. The new data set is also immediately available for your colleagues to use.
Entering Lines on a Map: Pathways, Streets, Power Lines, etc.
With WIGeoWeb, you can also freely draw lines on the map and enter line data according to your specific needs. Examples of line data can be: pathways, streets, no-stopping zones, length of outdoor seating zones, power lines, fiber optic lines, rivers, streams and, and, and.
Using Line Data - Example
Our customers use line data to answer questions like the following:
- How can I shorten the routes of my newspaper delivery team and make it more efficient?
- Where are the outdoor seating zones for cafés and restaurants in my city?
- Where are noise barriers along the highway in need of renovation and over what distance?
Entering Line Data
As with the entry of point data, you also have many options for entering data with lines, which you can choose and switch between in the software:
- via API interface
- Upload (e.g. shape file, GeoJSON, directly from ArcGIS and QGIS)
- Enter data on the go by simply drawing the lines or automatically aligning them with a street
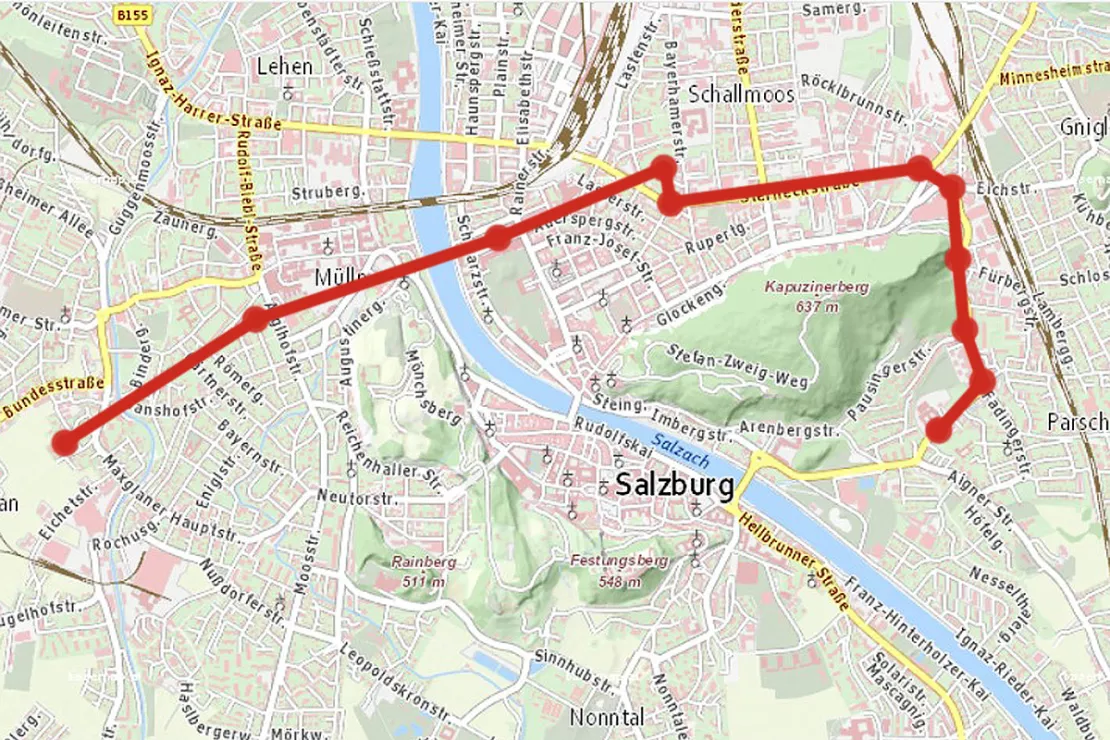
Drawing custom lines on a map yourself? You can with WIGeoGIS! Select the line symbol, click on the points on the map between which a line should be drawn, or draw a line completely freehand. Enter attribute information for the lines (e.g. delivery route east) and save the data record. The line and the associated information are immediately available to your colleagues in WIGeoWeb.
Entering Areas (polygons) on a Map: Zip Code Areas, Risk Areas, Sales Territories, etc.
In addition to point and line data, you can also enter areas with WIGeoWeb. Areas can be for example classic ZIP Code areas, municipalities, federal states, catchment areas, sales territories and sales representative areas, as well as areas with certain risks (e.g. flood zones), forest and agricultural areas, protected areas, etc.
Using Area Data - Example
In addition to point data, area data is the geodata that companies use most frequently. Because areas can be enriched with information (e.g. sales figures, market data) and analyzed. This is why WIGeoWeb is also ideally suited for regional market analysis and geomarketing. Companies use the combination of area data and other data for example to answer the following questions:
- How can I ideally plan sales territories?
- Will the regional reforms (such as the dissolution and merging of municipalities, changes in municipality and ZIP Codes boundaries) affect my sales territories?
- How are things going in my international markets? How is my sales penetration?
- In which districts is there a higher proportion of my target group for my direct marketing campaign?
Enter Area Data
- via API interface
- Upload (e.g. shape file, GeoJSON, directly from ArcGIS and QGIS)
- Freehand drawing of areas (polygons) on a map
- Create catchment areas directly in WIGeoWeb
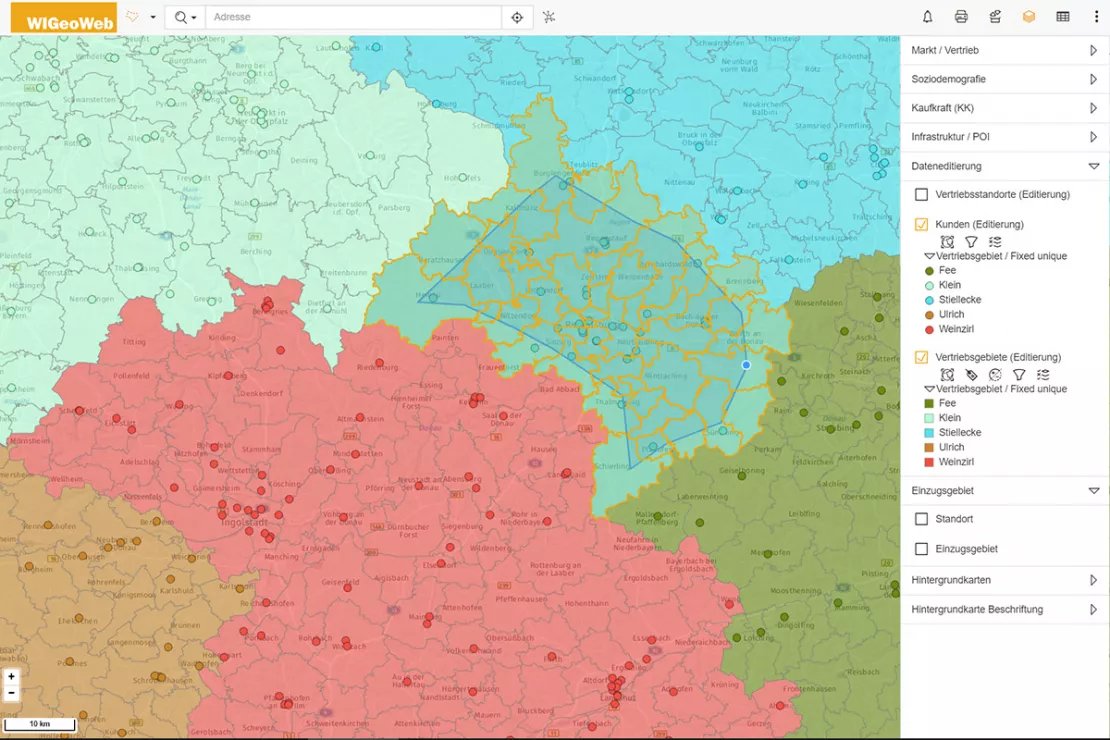
In WIGeoWeb you draw areas in any shape and geometry manually on the map or create new units from existing areas (polygons).
Would you like to enter points, lines and areas on a map? Yes, with WIGeoWeb!
2. Editing Data - Automatically or Manually
When data is entered in WIGeoWeb via the API interface or upload module, all the attribute information is transferred to the software at the same time. Enter the data manually or, if you are entering data on the go, enter the most important information immediately. For a competitor location for example, you might enter the name of the competitor next to a line with the name of the delivery route, or in an area with the name of the sales representative responsible for that territory.
If data has to be updated afterwards, this is done automatically with the API interfaces. Of course, you can also edit and update data manually, either for- individual records or multiple records at once.
The advantage of updating data via the map is: spatial assignments are done immediately. If, for example, a sales representative are is divided, all the leads and potential new customers are automatically assigned to the appropriate employees.
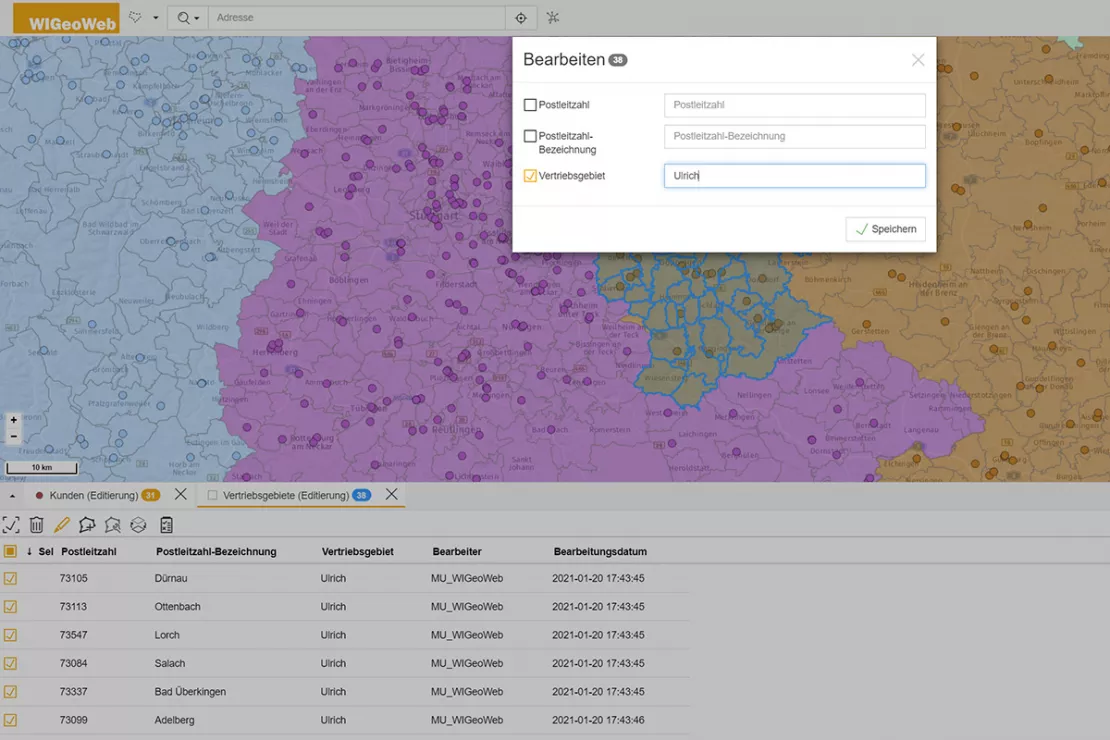
In WIGeoWeb, you have maximum freedom in how you choose to process your data: automated via interface, via upload, manually via freehand drawing and with the help of the batch editing function for multiple data sets at once.
3. Visualizing Data
Entering and visualizing data with WIGeoWeb practically occurs in a single step. Because as soon as you enter the data, it is immediately displayed on a map and in a table. The map is superior to other visualization tools. An image is created on the map that conveys several pieces of information all at once. These can be understood quickly and intuitively.
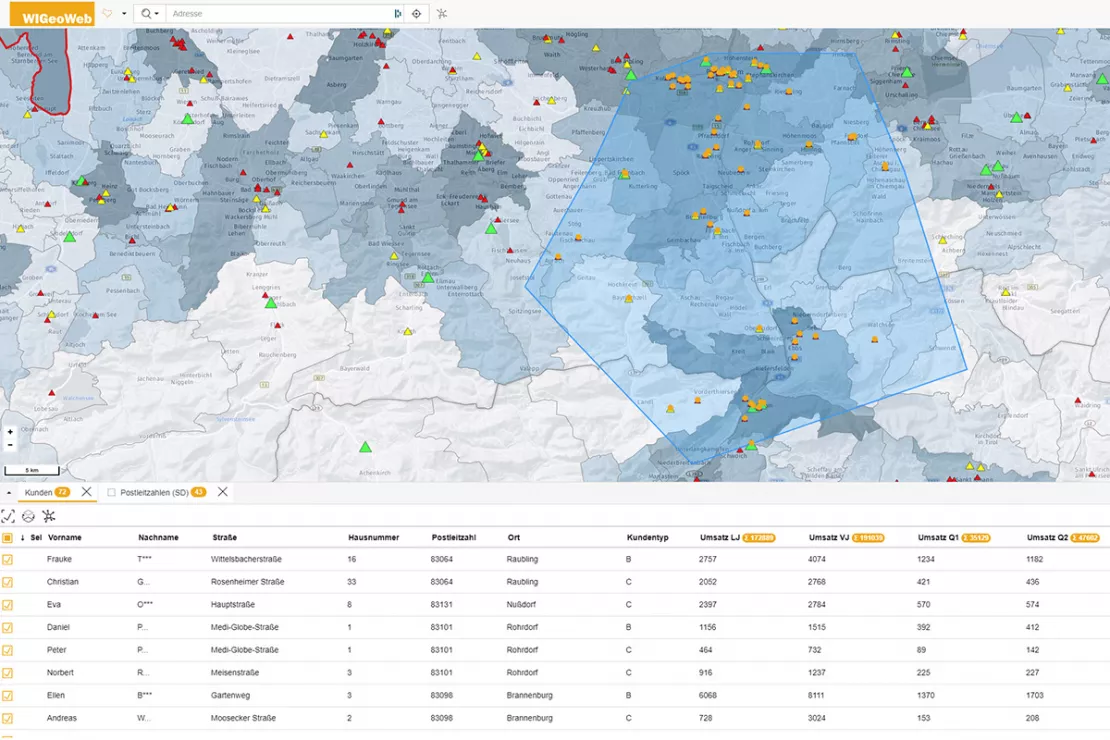
With WIGeoWeb, you can visualize data on a map. The data displayed in the table adapts interactively.
4. Using and Sharing Data
WIGeoWeb is for more than just entering, processing and visualizing data. In WIGeoWeb, you can also use data directly for multi-layered analyses: market analyses, penetration analyses, sales forecasts, target group analyses, location analyses, etc. All users can directly access the data entered and the analysis results. Who is allowed to see and edit which data and analyses is regulated by a rights and role management system that can be customized to meet your specific requirements.

A rights and role management system controls who can see
and edit what. You can provide your colleagues with your data and
analyses directly in the software.
WIGeoWeb: Fill out the form, test it free of charge & without obligation!
- Non-binding, free test for 30 days
- Test ends automatically without cancellation
- An employee will explain the tool in a short webinar*
* Information about the free test access: Standard regions with selected data in Germany or Austria will be made available. In Germany, these regions are districts in Munich and environs, and districts of Vienna and environs in Austria. The products of WIGeoGIS are intended for companies and are not suitable for private use. If you need a one-time market analysis, we will gladly make you a service offer.
FAQ
-
Where can I enter data with WIGeoWeb?
WIGeoWeb is a web tool. Therefore, it is possible to enter data wherever you have an internet connection. Be it in the office, in your home office or on the road at the customer, partner company or in front of a competitor’s doorstep. Data entry is possible everywhere. Data entry on the go is particularly practical as the location is recorded using GPS localization and you can save additional information directly. Whether entering data on the go via GPS localization or setting a location on a map, the system directly and automatically suggests the appropriate address.
-
When can I enter data with WIGeoWeb?
Since WIGeoWeb is available as an online tool anytime and anywhere, you can enter data whenever you want. All you need is a WIGeoWeb account.
-
Who can enter data with WIGeoWeb?
WIGeoWeb is a tool for companies and organizations and must be licensed. If a company or organization uses WIGeoWeb, anyone who has been given access rights in the system can enter data. You decide who is allowed to enter data via the individual rights and role management system in WIGeoWeb.
-
What data can I enter with WIGeoWeb?
As a WebGIS software, WIGeoWeb focuses on spatial and geographical data. Therefore, data is also entered on a spatial basis, i.e. addresses are automatically assigned X/Y coordinates and recorded as a point on a map. Lines (e.g. streets) and areas (e.g. ZIP Codes) can also be entered and displayed on a map. You can save any other information you want about this data, e.g. name, turnover, socio-demographic data, characteristics, etc.
-
Can I use my mobile phone on site to enter data for WIGeoWeb?
Generally speaking, entering data on the go with a smartphone is possible. However, we recommend entering data on site using a tablet or laptop. Smartphone displays are generally too small to comfortably display and work with a map.
-
Where is the data entered stored?
You decide where your data will be saved when you purchase your WIGeoWeb license. The system can be installed in your company on your own servers. If you choose WIGeoWeb as Software as a Service (SaaS), then the data entered will be saved on WIGeoGIS's own servers in Europe.
-
Who can use the data entered?
Exclusively YOU and people who you allow to use WIGeoWeb via the rights and role management system. You can also control who can use the data within your company via the rights and role management system.
-
Can I also analyze and present the data entered with WIGeoWeb?
Yes, of course! WIGeoWeb is ideal for all kinds of analyses, especially for market analyses, penetration analyses, target group analyses, sales territory analyses, catchment area analyses, etc.
-
Can I export data that was entered in Excel to WIGeoWeb?
Yes, it is possible to export data that was entered in Excel to WIGeoWeb. You can upload addresses from an Excel file directly in WIGeoWeb. The data is automatically located as points/pins on a map (via geocoding). For data relating to ZIP Codes, municipalities, lines etc., a connection is made to the corresponding geometries, so you can easily connect and update your data at a ZIP Code or municipality level with the geometries in WIGeoWeb.
-
Can I update or edit data that I have already entered?
Yes, you can do that anytime, anywhere. There are three ways to do this:
- By uploading the data from XLS, QGIS or ArcGIS.
- Automatically by integrating your systems, such as CRM or ERP.
- On the map or in the table.
Test it yourself - Enter and Edit Data with WIGeoWeb

