Data Analysis with WebGIS
Analyze & Understand Data Intuitively
A WebGIS is a data analysis software that allows you to place your data in a spatial context and view the analysis results on a map. This georeference provides insights that would otherwise remain hidden with traditional analysis tools.
80% of Company Data Has a Spatial Reference. Take advantage of this aspect for your data analysis and gain a decisive competitive advantage.
When you analyse data with WebGIS software, you can see at a glance WHERE your business is running, where you have potential and where you don't. This allows you to take targeted and efficient measures.
What is Data Analysis?
Data analysis is a multi-step process. Internal company data and external market data are converted into a readable form that can be evaluated using software to provide you with information and ultimately insights for your operational business. Various statistical methods and procedures help you to recognize trends and patterns and even make predictions. The data analysis software provides you with a clear and intuitive visualization of your data, enabling you to make quick and well-founded business decisions based on the analysis results.
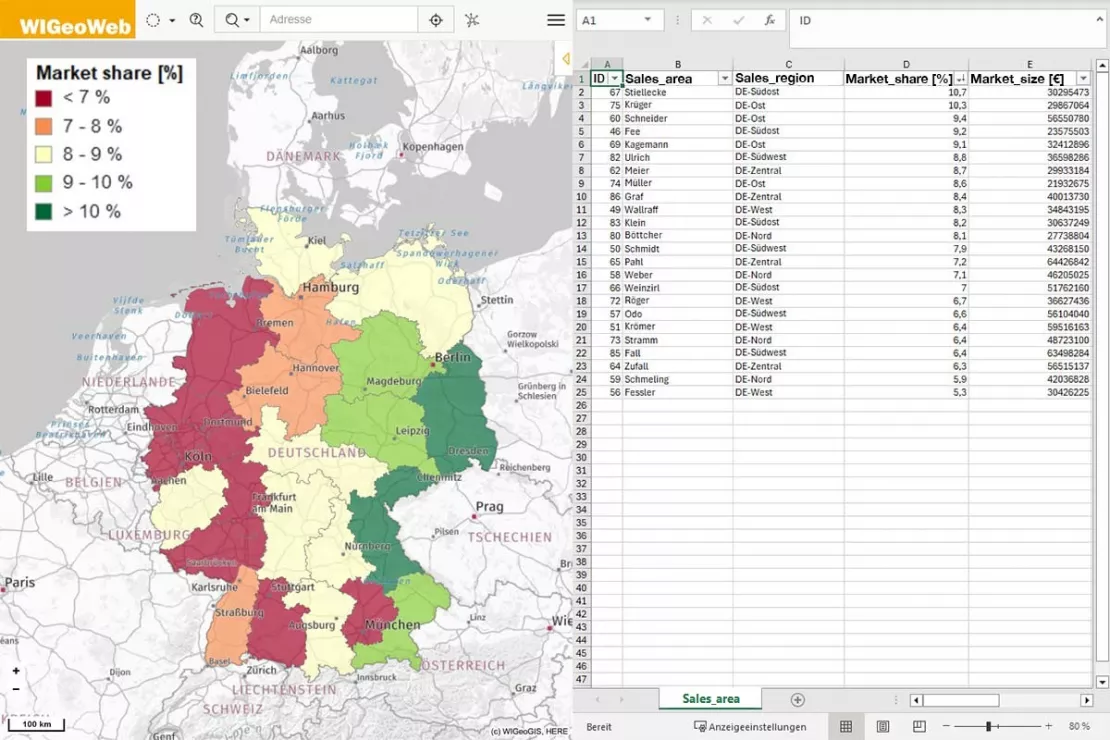
Left: Data analysis software WIGeoWeb, right: Excel. Both screenshots show the exact same data on sales areas and their potential utilization.
The software analyzes this data spatially and visualizes the results on a map
Many companies are not even aware that they can take the dimension of space into account in business and data analyses. This is interesting, considering most business data already has spatial information: company locations, sales territories, customer addresses, etc. All these are data with a spatial reference. Most business activities also take place in a real place, in real space. Even for online purchases, there is at least one location, namely the delivery address. Thus, spatial information always has an immense influence on your business activities and your business success.
A WebGIS (Online GIS) is the only data analysis tool that integrates spatial information into your business analyses, enabling you to benefit from the advantages of geomarketing analysis. WIGeoWeb is a modern WebGIS that you can use to analyze your data intuitively, at different spatial levels directly in your web browser. This means that you and your employees have the power of geoanalysis at your fingertips, anytime and anywhere.
Once we have put WIGeoWeb into operation for you, you can carry out standardized geomarketing analyses. The web-based data analysis tool is intuitive and easy to use. We can host the software for you, you can use it in the cloud or you can host it in your infrastructure.
Analysing data with spatial reference? Request your WIGeoWeb test account for free with no obligation.
Video Tutorial: Analyze data with WIGeoWeb
Watch the step by step video tutorial to learn how to use WIGeoWeb to perform a sales potential and performance analysis (English subtitles available).
Benefits of Data Analysis with WebGIS
- Make large amounts of data visible and intuitive to read and understand
- Recognize spatial structures
- Understand location-based relationships
- Find outliers
- Make location-based forecasts
- Geodata analysis, anytime and anywhere
1. Make Large Amounts of Data Visible and Intuitive to Read and Understand
Today, there is no lack of data. On the contrary. Many companies are overwhelmed by the amount of data available for analysis. The problem is that information from databases is difficult to read immediately. WebGIS software perfectly visualizes analyses and data on a map.
For example, with WebGIS you can see
- which Zip Codes are adjacent to each other
- which sales areas are adjacent to each other
- the size and sales figures of your sales areas
- which neighborhood relationships exist between your locations, branches and sales areas
- which transport connections and infrastructure exist in an area and around a location
- what distances lie between locations by measuring them directly in the digital map
All this information is immediately available with a WebGIS. This information can not be read directly from tables or graphs.
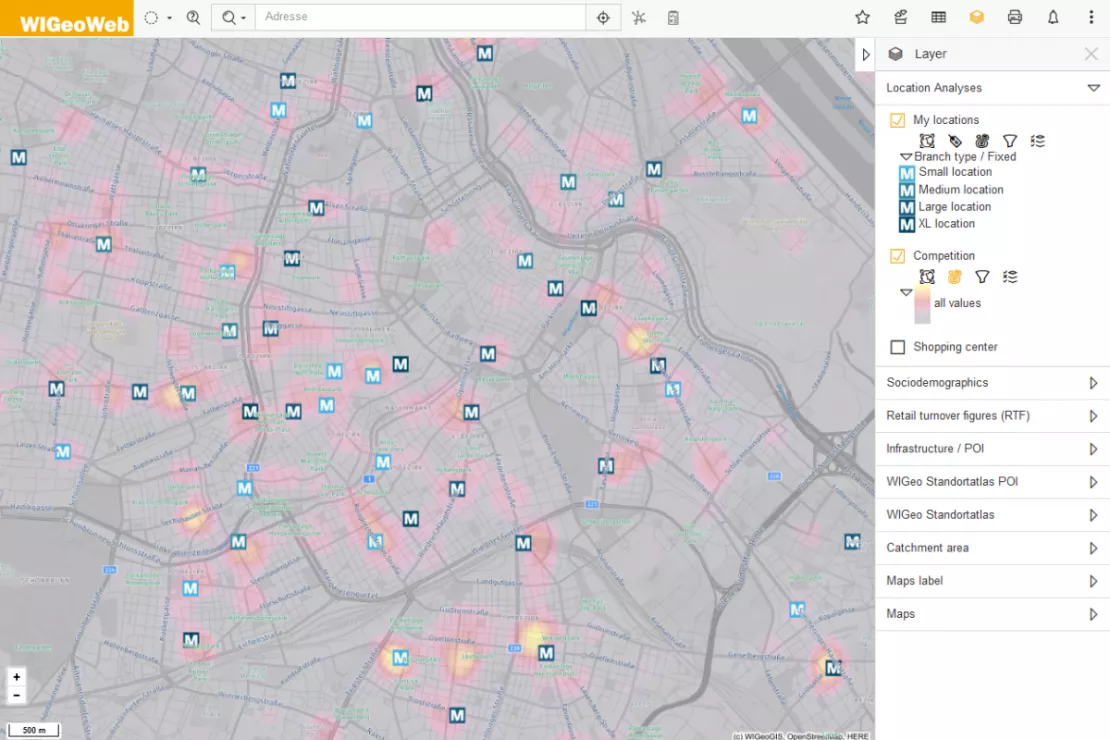
Screenshot of the WebGIS software for data analysis WIGeoWeb: Here you can see your own locations as points on the map and the locations of competitors visualized using a heatmap, thus making large amounts of data intuitively understandable.
2. Recognize Spatial Structures
Digital Maps, Geodata and WebGIS Software Provide You With a Wealth of Information about Spatial Structures.
Is a region densely or sparsely populated, a suburb or city center, an industrial or tourism region, with good infrastructure or poor roads, a university center or emigration region?
You will receive answers as to how these factors influence your business metrics and your business strategies in a region or even a neighborhood.
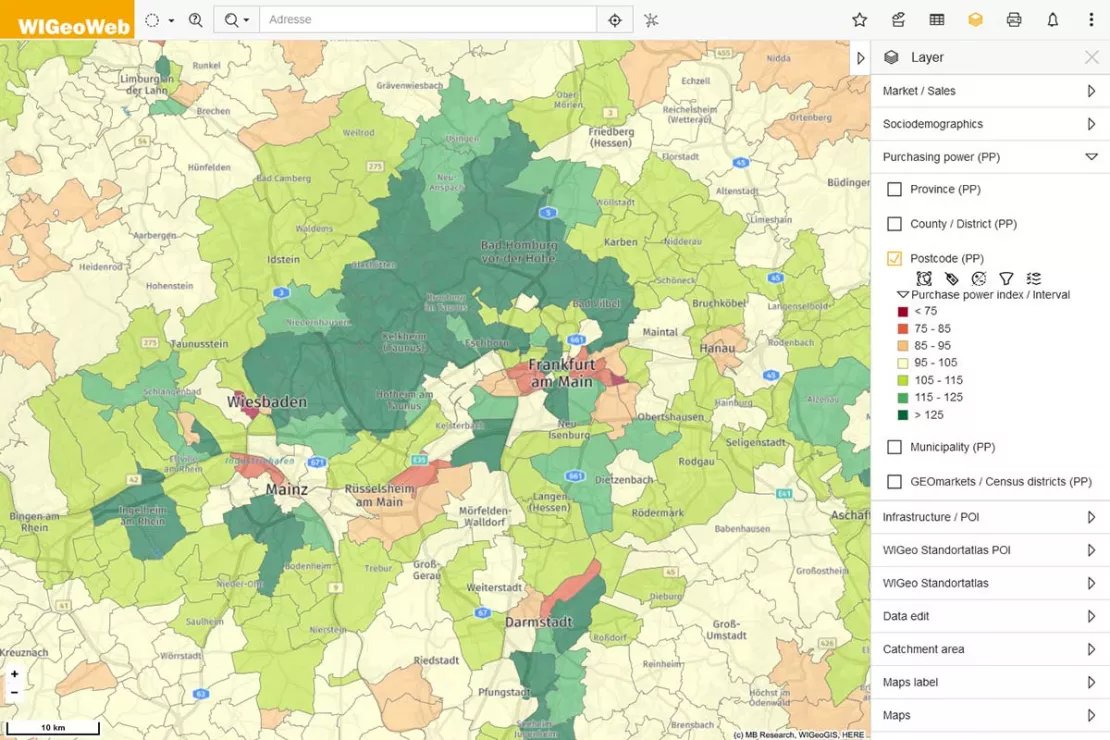
Screenshot of the WebGIS software for data analysis WIGeoWeb: Recognize spatial structures: Here you can see the regional differences in the purchasing power index in the Rhine-Main region.
3. Understand Location-Based Relationships
What Are Location-Based Relationships?
They can be distances between locations, distances between customers and representatives, barriers such as rivers, highways, mountains, footfall and footfall generators, traffic based on time of day, commuter flows and much more.
All this information can be visualized and analyzed on digital maps. You can compare your company data with the respective location-based relationships. Moreover, you can recognize and operationalize these relationships in your data and your corporate world.
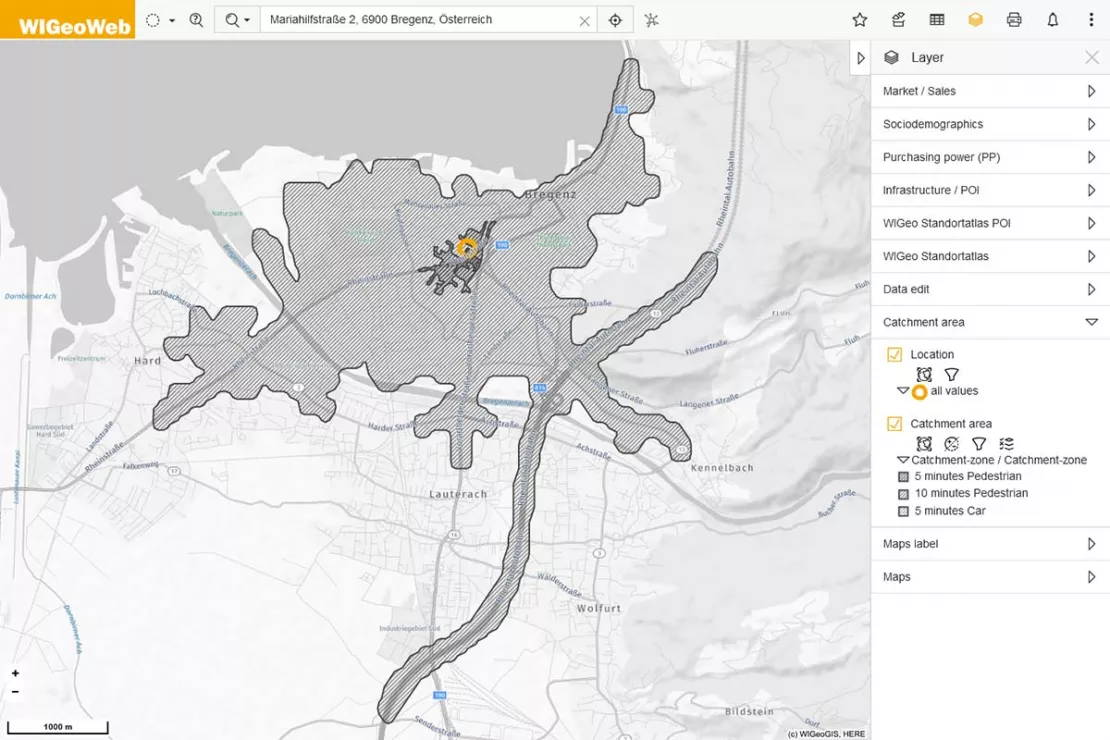
Barriers such as rivers, lakes, but also highways or railway lines define catchment areas. Here you can see a catchment area in the city of Bregenz on Lake Constance.
4. Locate Outliers
What Are Outliers?
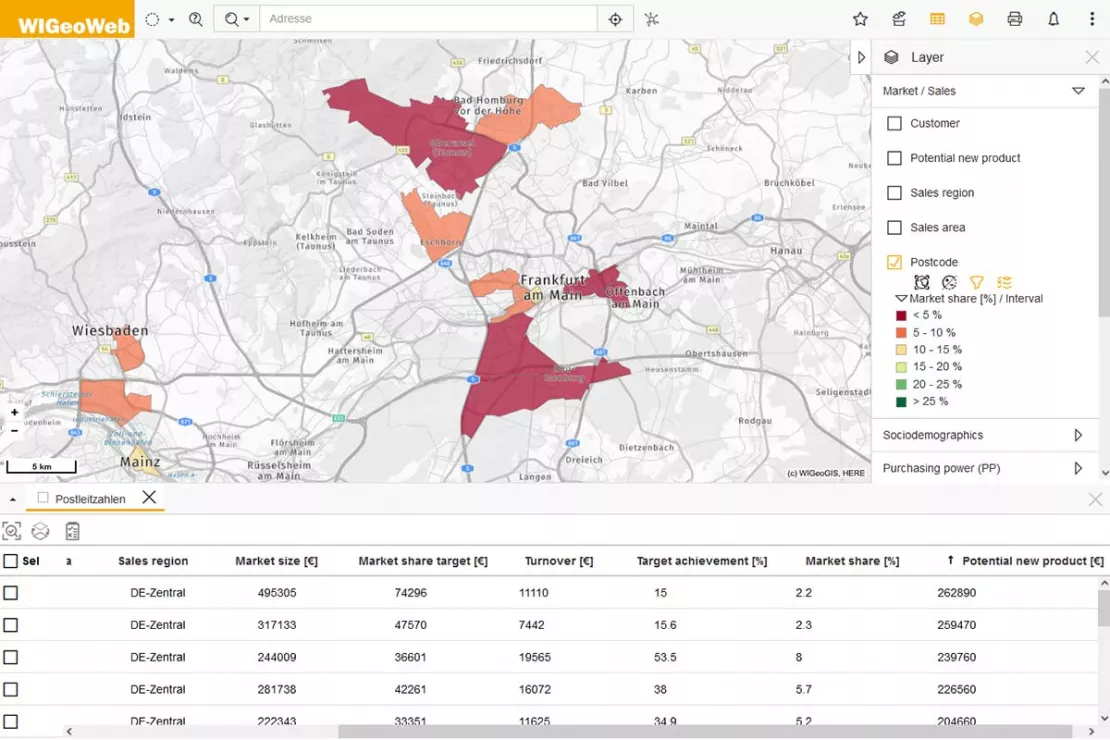
Outliers would be, for example, communities with extremely high purchasing power, below-average turnover, a high number of returns or neighborhoods with a high population density, company density or car density. These are demographic features that appear concentrated in small areas.
It is important to recognize regional outliers, regardless of whether the characteristics are positive or negative for your business success. The knowledge gained is worth gold for you.
5. Make Location-Based Forecasts
Are My Planned Investments Worthwhile?
Would an investment make sense? How high is my risk? Are investments made in the planned location?
With the help of WebGIS software and various spatial methods, such as gravity analyses and scoring analyses, it is possible to make location-specific forecasts for sales, demand and usage.
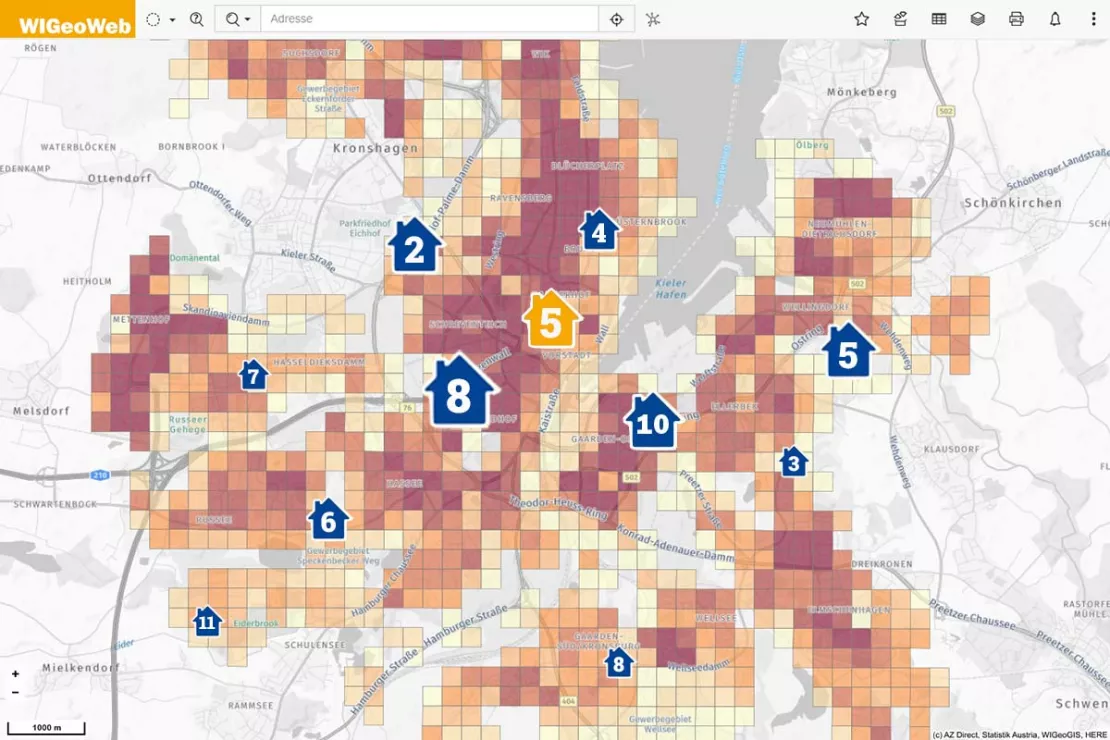
Example of results of a location-based sales forecast with the help of a gravity analysis; the darker the cell, the higher the predicted sales, the larger the house symbols, the higher the attractiveness of existing locations.
6. Geodata Analysis, Anytime and Anywhere
WebGIS Runs in Your Web Browser. This gives you the freedom to analyze data anytime, anywhere
Today’s working world is mobile. So the work infrastructure should be also. A WebGIS runs in your web browser, so you can access the tool at any time, whether in the office, at home or on a business trip. WIGeoWeb works on PCs, laptops and tablets to give you as much flexibility and freedom as possible for your data analysis.

WIGeoWeb supports the contemporary way of working: agile, mobile and modern.
Test it yourself - Analyze Data with WIGeoWeb
Overview: Typical Data Analysis and Geomarketing Analysis with WebGIS
A WebGIS enables a variety of data analyses. Take a look at the typical geomarketing analyses that you can perform with WebGIS.

Analyze Market Penetration
With geomarketing you can find potential customers, turnover and sales! Compare your company key data with current market data on a small scale.
Target Group Analysis and Geomarketing
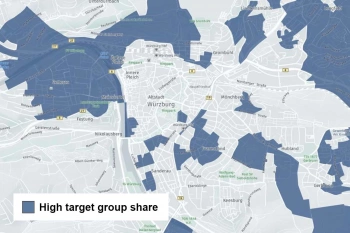
Target group analysis with geomarketing reveals regional potential and its distribution.
“The big difference between data analysis with a BI system and data analysis with WebGIS is that WebGIS uses space as the basis for the analysis and visualizes the results on a map rather than in graphs.”
Wolf Graf, CMO WIGeoGIS
What Are the Benefits of Data Analysis with GIS?
Prof. Dr. Petra Staufer-Steinnocher from the Vienna University of Economics and Business and Nato Klems from CLAAS give a brief overview of the key advantages of data analysis with geomarketing software and WebGIS in a video interview.
In addition to the advantages for data analysis, WebGIS offers even further potential, such as the creation of interactive maps and an ideal visualization of data.
Try the data analysis software WIGeoWeb now!
WIGeoWeb: Fill out the form, test it free of charge & without obligation!
- Non-binding, free test for 30 days
- Test ends automatically without cancellation
- An employee will explain the tool in a short webinar*
* Information about the free test access: Standard regions with selected data in Germany or Austria will be made available. In Germany, these regions are districts in Munich and environs, and districts of Vienna and environs in Austria. The products of WIGeoGIS are intended for companies and are not suitable for private use. If you need a one-time market analysis, we will gladly make you a service offer.
FAQ
-
Is WebGIS software a data analysis software?
Yes! With WebGIS software you can analyze any data, such as internal company data, market data, potential data, frequency data, data from customer surveys, etc.
-
What are the advantages of analyzing data with the help of WebGIS and GIS (= geographical information systems) and digital maps?
The biggest advantage is the visualization of your data. You see your data on digital maps. This allows you to quickly see where you are performing well or poorly, where you you have high potential, where you have white spots and much more. A further advantage is the use of space as a level of analysis. You analyze all your data with a spatial reference and thus draw relationships between different data. This allows you to quickly recognize neighborhood relationships, interdependencies and natural barriers.
-
Which analysis methods can be performed with your data analysis software WIGeoWeb?
The following data analysis methods are mostly used with our software: what happened (descriptive), what could happen next (predictive) and what should happen in the future (prescriptive). Depending on the requirements, these are used in market, location, target group and potential analyses.
-
How can you analyze data with WebGIS software? Are there certain requirements?
In order for data to be analyzed in a WebGIS, it must be enriched with geodata. This happens automatically in our WebGIS if customer addresses, location addresses or other spatial data are available (e.g. Zip Codes).
-
Can you visualize data that was analyzed in Excel in a WebGIS and continue the analysis there?
Yes, that is possible. You can easily upload data from Excel to our WebGIS WIGeoWeb. The data can be further processed in WebGIS and used for further geo, market, potential and target group analyses.

