Data integration in GIS and ETL processes
Get Added Value from Your Data with Interactive Maps and Geo-Analyses
Do you have valuable data and want to merge it into an interactive map in order to perform geo-analyses? WIGeoGIS takes care of the data integration into a geographic information system and the ETL process.
Integrate data with automated ETL processes
If you are reading this text, you are probably sitting on a treasure trove of data in your company that is just waiting to show you its true value. To do so, you would have to display your data on an interactive map. However, you probably first have to learn how to load your data, which is organized in Excel files or other common file formats, into a Geo Information System (GIS) for display on a map.
To do this, the data from the original lists and files must first be
- extracted (Extract – E)
- transformed (Transform – T)
- and finally uploaded into the interactive map in GIS (Load – L).
The WIGeoGIS team takes care of this so-called ETL process (Extract – Transform – Load).
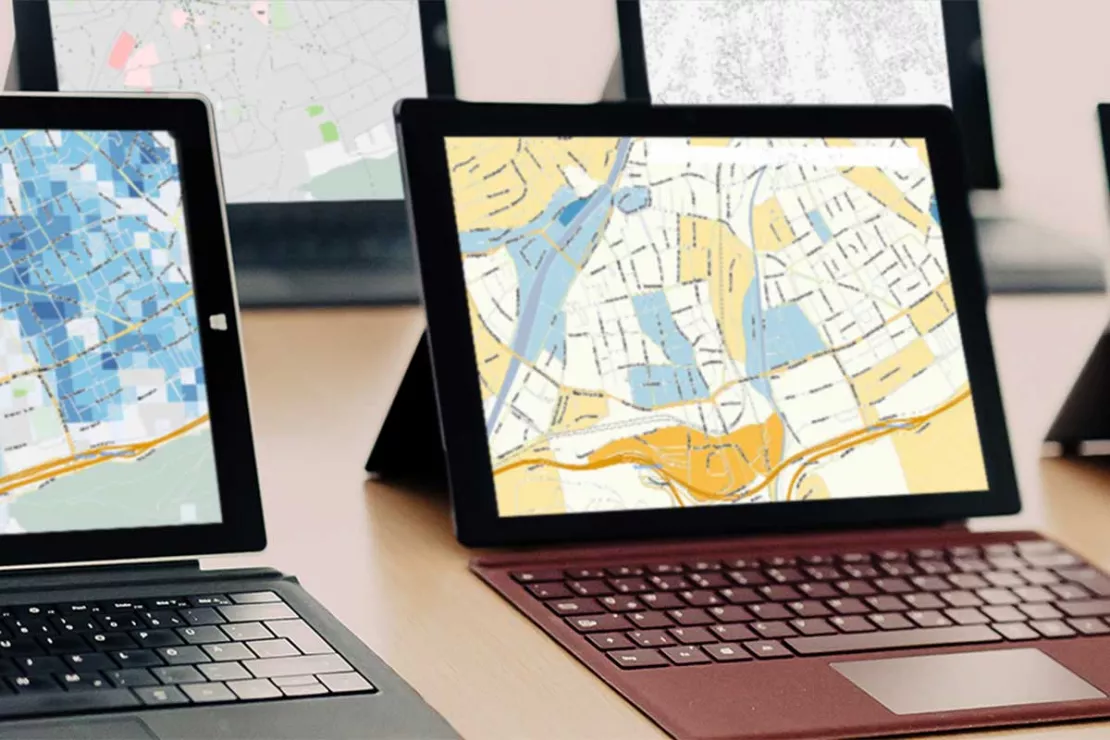
The Optimal Data Integration
WIGeoGIS is an expert for ETL processes and data integration in GIS. With tailor-made software products for professional data integration and our outstanding team, we are the right people to contact for all your GIS needs. Benefit from our know-how:
What are the benefits of data integration?
- Data integration saves time
- Through data integration, company departments and software systems work better together
- Data integration leads to fewer errors
- Data integration requires less editing
- Data integration enhances data
- Through data integration in GIS systems, data can be visualized on interactive maps
What is the benefit of data visualization on interactive maps?
Let’s start with an illustrative example!
A company maintains several lists in its database, including an address list of customers and an address list of technicians who work for the company. Now the company wants to assign the right technician to the customers in such a way that they have the shortest travel distance possible.
The assignment using the two address lists is an extremely tedious affair. However, if the customers and technicians are displayed on a map, you can see at a glance which technicians are closest to which customers. If the geo information system (GIS) is automated, it regularly retrieves the current status of the lists so that the company can always make up-to-date plans.
Curious? We are happy to provide consultation on ETL processes and Data integration in GIS!
Methods and Benefits of Data Integration in GIS and ETL Processes
Variants of Data Integration in GIS
Prepare and Integrate Data Spatially
How do you display your address, contact, location and other data on a digital map?
The data is extracted (E) from its original source, such as an Excel spreadsheet, by a so-called ETL process, then it is transformed (T) into a new format that can be displayed on a map and finally it is loaded (L) into a GIS, for example WebGIS or QGIS.
The data in the lists or files, which are available in different formats, are prepared spatially so that they can be displayed visually on an interactive map in the GIS. WIGeoGIS takes care of this data integration for you.
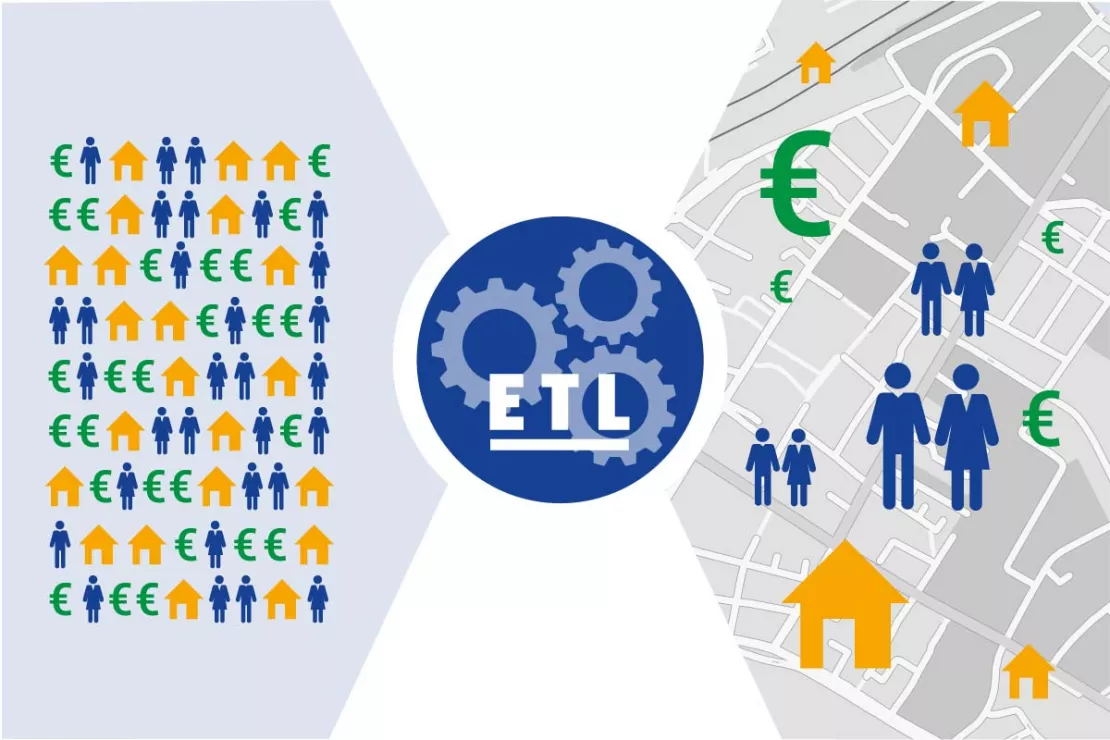
Image: Data integration processes make the data, which mostly comes from different sources and systems, “GIS-compatible”.
Depending on the specific starting point and the goal of the data analysis in GIS, this process requires other intermediate steps. The address data often has to first be
- geocoded,
- aggregated into larger units,
- or conversely, disaggregated into smaller units,
- generalized and
- enriched with additional information.
At the end of this process, you get much more value out of your data: You can use our GIS software to display the visualized and linked data on a digital map so it can be
- evaluated,
- analyzed and
- used to make operational decisions.
In this way, you will be able to make future decisions on a solid, data-based foundation.
Why is geocoding a prerequisite for data integration?
In order to be able to display spatial information such as addresses on a map, it must first be geocoded.
In concrete terms, addresses are converted into coordinates by geocoding so that they can be represented as points on a map. This happens with the help of address databases that contain, for example, the coordinates of all addresses in Europe. We at WIGeoGIS, look for the data point that matches the respective address and provide the address with the appropriate coordinates.
TIP: The better the data is maintained in the address database or list, the easier the geocoding process is! If there are errors here, such as transposed digits and incorrectly spelled street names, the correct numbers and spellings must first be found, otherwise the address will be displayed incorrectly on the map.
Are you interested in the advantages of ETL processes and data integration in GIS?
What is the point of aggregating data into larger units?
A common way of spatially preparing data is aggregation. This combines several data points to form a larger unit.
A typical example is aggregating sales from ZIP Code to state or district level or from state to country level. In this way, the GIS shows you at a glance how many sales were made in a specific district, even though the original lists only contained sales per ZIP Code.
“Aggregation is the process of combining multiple small data points in order to draw information from them. For example, I have customer points and I know the sales that each customer has generated. When aggregating, we summarize the customers per municipality so that statements can be made about the sales in the municipalities. The sales in the municipalities can then also be compared with one another. This is just one example of data aggregation. Of course, municipalities can also be aggregated into states in order to make a statement about the sales in the states.”
Andreas Marth, Head of Solutions, WIGeoGIS
Aggregation is often about sales figures. But also the potential in different regions can be combined into larger regions such as states, so that the interactive map shows which states have the highest potential.
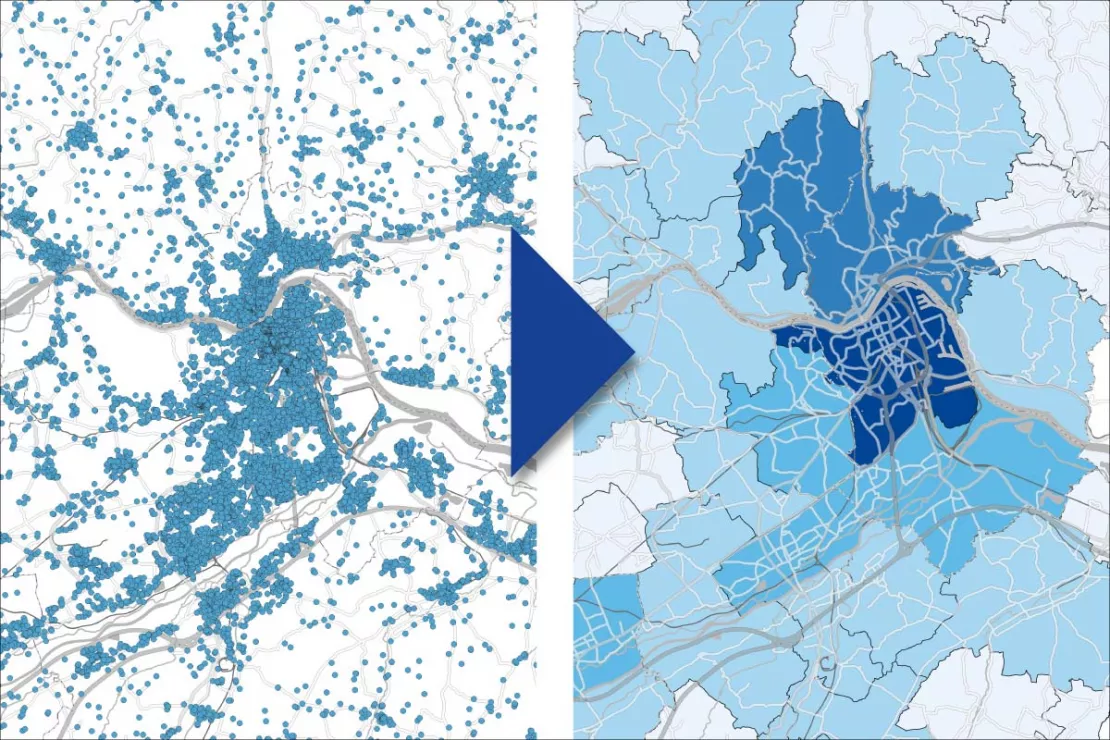
Image: A common method of data integration is spatial aggregation. Points such as customers, inhabitants, etc. are aggregated into areas and the aggregated values are made visible with colors.
When is data disaggregation needed?
Disaggregation is the reverse of aggregation. For example, you only have a certain value at a state level, but all the other values are at a community level, and you want to make statements about communities.
To make this possible, we use the method of disaggregation.
“A disaggregation is usually done when data in finer granularity is either not available across the board or is very expensive.”
Josef Mayer, Head of Solutions, WIGeoGIS
Example: Although I know how many car registrations there are per district, in the GIS I need this number one level down at the ZIP Code level. If 100,000 cars were registered in a county with ten ZIP codes, I cannot assume that 10,000 cars were registered in each ZIP Code area. That would be too simplistic and would not reflect reality. We therefore use various keys and auxiliary variables, for example the number of inhabitants, the built-up area or the number of residential buildings in the individual ZIP Code areas. We then distribute the car registrations to the ZIP Codes according to these keys.
Important: A disaggregation is always just an approximation of reality. However, it is often better to work with probable values than to omit certain data altogether.
Because disaggregation often involves combining data from spatial units with different resolutions, a reliable calculation is only possible at the spatial level. If you only have the corresponding numbers and data as a table or list, you can only use the method to a very limited extent, or you first have to geocode these numbers and put them on a digital map.
Many WIGeoGIS customers, including Claas and Stihl, already benefit from the disaggregation method. WIGeoGIS also disaggregates data for Fressnapf:
“We perform a disaggregation of the potential data in different countries with different data accuracies and calculate customer-specific potentials on a 500 x 500 meter grid. This gives us a uniform database across countries and we can perform our analyses using the same scheme, with the same data quality and in a way that is comparable across countries.”
Giuseppe Mustillo, Head of International Expansion Analytics and Controlling, Fressnapf Immobilien- und Vermögensverwaltungs GmbH
If you would like to learn more about ETL processes and Data integration, simply contact us and we will be happy to answer all your questions!
What is the benefit of generalizing data?
For our interactive maps in WebGIS or QGIS, we use data from commercial providers or from freely accessible sources. These maps are often very finely digitized. If, for example, the complex coastline of Finland is represented very precisely, this is usually unnecessary for a geo-analysis in a GIS, because practically no people live there.
“We generalize data to get a more aesthetic representation and better performance.”
Josef Mayer, Head of Solutions, WIGeoGIS
It is often better to generalize this data, i.e. to simplify its boundaries, because otherwise the display performance of the map will be impaired due to the high level of complexity. The challenge here is, on the one hand, to achieve the necessary degree of simplification, but on the other hand, to continue to maintain consistent areas. Ultimately, there should be no gaps or overlaps between areas. To achieve this, one omits those points that are less important for the shape of an area. Borders are adjusted to make them more workable while still largely retaining their original shape.
Automating ETL Processes
ETL processes, in other words, extracting, transforming and loading the data to the GIS, are usually automated, so that a change in your database automatically appears on the interactive map. At regular intervals, for example, once a week, once a day or every minute, the GIS retrieves the data from your database, for example from various Excel lists and other files. This way you do not have to re-upload the list yourself every time you make a change to it and your WebGIS or QGIS is always up to date.
“By automating the ETL process, the customer does not have to worry about whether or when they need to update the data in the GIS.”
Andreas Marth, Head of Solutions, WIGeoGIS
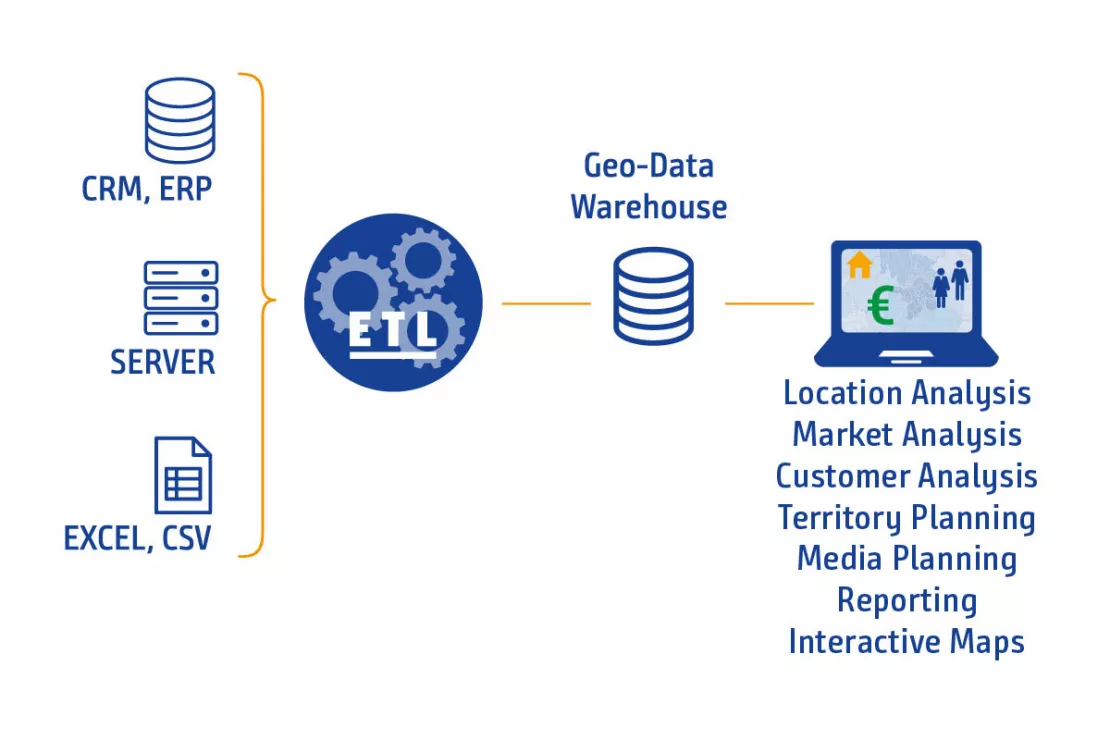
Image: Data from different sources and systems can be combined using ETL processes and made “GIS-compatible”.
Especially in corporations and larger companies, it is usually not easy to collect the data from the different data pools and to ensure that they are regularly updated in order to use them for geographical analyses. Automated data integration helps here.
A WIGeoGIS customer who already benefits from the advantages of the automated ETL process is the Austrian Post:
“With the help of WIGeoGIS, we have created a location planning tool that brings together the relevant information from various internal and external data sources on one platform. Automated processes for data preparation and analysis are carried out in the background to ensure that decisions are always based on the latest data and up-to-date knowledge.”
Simone Ortner, Österreichische Post AG
Many users benefit
from automated ETL processes. This automates “Excel to Map and Report”
workflows. Contents from the Excel spreadsheets are always up-to-date in
map reports. This saves a lot of time compared to a manual and
non-automated analysis.
Free initial consultation for ETL processes and Data integration in GIS. We will explain how it works and what you will need!
Why is enriched data more valuable?
Everything that is enriched gains in value. Data too is more valuable when it is enriched. As a rule, data is enriched with the following information:
- Internal company information
- Geographic information
- Demographic information or
- A combination of the above characteristics
“As soon as I put an address on the map, I can enrich it with all the information that I have in the GIS from other sources.”
Josef Mayer, Head of Solutions, WIGeoGIS
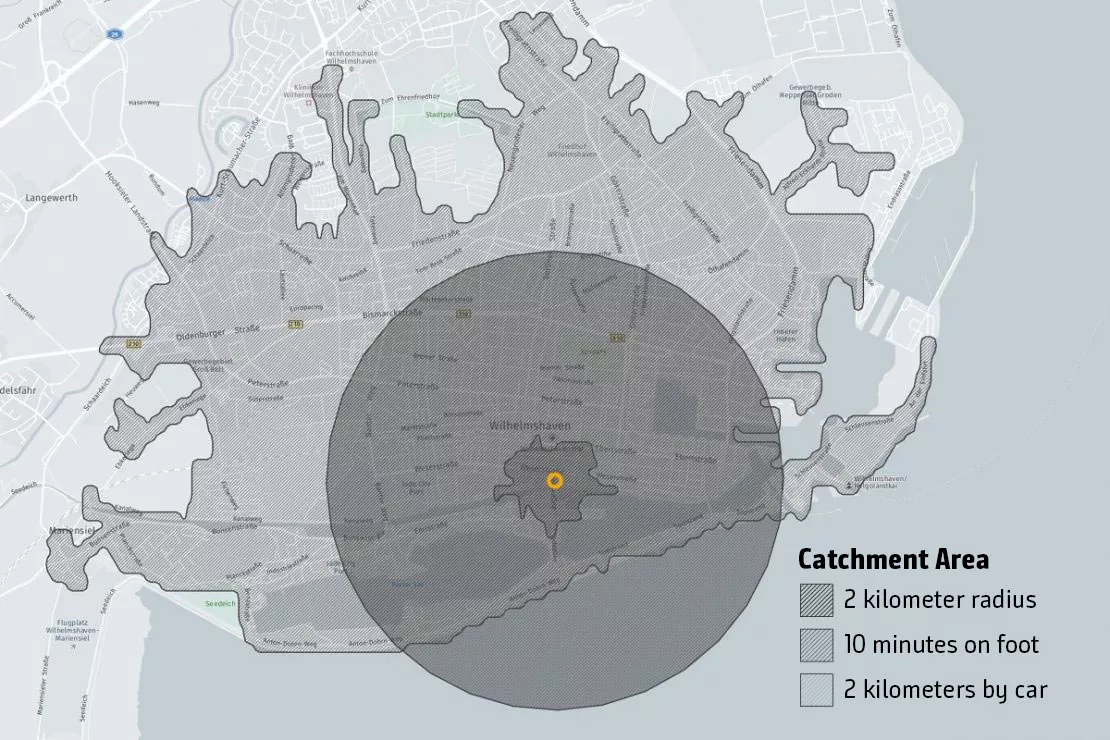
Image: For location analyses, companies enrich locations with relevant information about the location environment. Competitors, inhabitants, purchasing power and more are determined for each catchment area. This is important in order to standardize and objectify corporate decisions.
Some examples of data enrichment
- You add coordinates to the customer data record and see on the digital map with one click which customers are 20 minutes away from a location.
- You enrich customer data records with the information about which sales representatives they are assigned to and see which employees look after how many customers, where they are and how much they ordered in the last quarter on the interactive map.
- You enrich geographical data with spatial characteristics, for example with the information that they are located in a tourist or industrial area or on a main road.
- Geo-data can also be enriched with information on purchasing power, age structure and employment rate, the percentage of university graduates or children in a region. For example, the percentage of babies allows conclusions to be drawn about the need for diapers.
Many WIGeoGIS customers benefit from data enrichment.
Arrange a free consultation on ETL processes and Data integration in GIS
Visualize, analyze and use data operationally
All the processes described above are not ends in themselves, but are based on very specific tasks. Ultimately, a company wants to analyze its data in the GIS and thereby make better operational decisions. The data integration and the processing of data is the basis for further analyses.
Questions like these can be answered, for example, by analyzing data in WebGIS:
- How high are my sales in certain areas in relation to the number of inhabitants?
- Are my customers in areas with high or low purchasing power?
- Where can I reach the most customers from my target group?
- Where does the map with my location network still have white spots? How do I rate my locations and should I close, expand or relocate them?
“The result of the data preparation and integration can be used in many ways: for example, to make location decisions, plan sales territories or determine customer penetration in a region.”
Josef Mayer, Head of Solutions, WIGeoGIS
This path consists of four steps:
- Entering Data
- Putting data on the map
- Visualizing and analyzing data
- Deriving findings and making a decision
You and your company make the operational decisions yourself, but on the way there, WIGeoGIS is the perfect partner at your side with the necessary know-how, GIS software and decades of experience. We know the necessary requirements and take care of your data integration so you can focus on your core competence.
These companies put their trust in WIGeoGIS to handle their ETL processes and data integration in GIS

Data Integration, Database & Analysis at TERRAGON
With a combination of a database developed in-house and the integration of the WebGIS WIGeoWeb, the market leader for high-quality senior housing has gained a unique knowledge advantage.

Case Study WebGIS: This is how CLAAS uses WIGeoWeb
Potential analysis, market analysis and territory management all with one WebGIS! Yes! CLAAS has been using its own WIGeoGIS WebGIS to answer many questions since 2014.

ANWR GROUP uses WIGeoLocation
The trade cooperation ANWR GROUP generates location analyses for the specialist trade using WIGeoLocation.
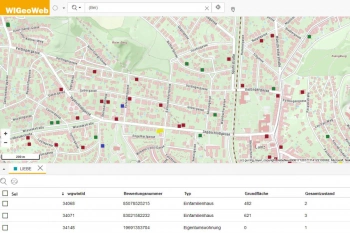
WIGeoWeb in Real Estate Appraisal
For example, Real(e)value enhances its proven, high-performance real estate appraisal tool by spatially representing the data using WebGIS.
Data integration in GIS and ETL processes: Request a free initial consultation
- FREE initial consultation*
- Non-binding, without further obligations
- By telephone or video call
Do you want to know more about ETL processes and Data integration in GIS? I will gladly support you. Please contact me!
* The products of WIGeoGIS are intended for companies and are not suitable for private use. If you need a one-time market analysis, we will gladly make you a service offer.
FAQ
-
What should be considered when integrating data into GIS?
The data must have a spatial reference. This can be an address, an administrative or postal identifier. Of course, coordinates can also be processed. In this case you need to know in which projection your coordinates are located.
-
What technologies are used for ETL processes at WIGeoGIS?
WIGeoGIS uses WIGeoETL for ETL processes. This software is used in combination with the Python programming language. This enables a high degree of transparency and traceability.
-
How does the ETL process work?
- The defined data is exported from the respective data source (e.g. CSV files from a database or from another data interface).
- Depending on the specification, the corresponding GIS processes are usually implemented automatically via Python script.
- The data then goes into the geodatabase, where it is available for use in the GIS.
-
How does an ETL project with WIGeoGIS usually work?
In a joint workshop, we define your special requirements and determine the technical framework. After a short, fast implementation phase, the first results become visible.
-
Where are the servers that process the data located?
The servers are located in the WIGeoGIS data center in Vienna or in the data center of your company or your service provider.
-
How is data security guaranteed during data integration?
We only work with encrypted protocols and the IT infrastructure is subjected to regular security tests.
-
Which formats are processed during data integration in GIS?
We process all common data formats. The data can also be exported in all common GIS formats and data formats.
Curious about the benefits of ETL processes and GIS data integration? We’re happy to advise you!

